


Reviewers:
Overview
This tutorial covers the basics of key data formats that may contain spatial information including shapefile, GeoTIFF and .csv. It also provides a brief overview of other formats that you may encounter when working with spatial data.
R Skill Level: Beginner
Goals / Objectives
After completing this activity, you will:
- Understand two key spatial data formats: raster and vector.
- Understand the basic structure of a GeoTiff file as a key raster spatial data format.
- Understand the basic file structure of a shapefile as a key vector spatial data format.
- Understand the basic data management / file storage approaches for working with shapefiles which contain multiple associated files.
- Understand where metadata are often stored in both raster and vector data formats.
Install R Packages
- raster:
install.packages("raster") - rgdal:
install.packages("rgdal")
Set Working Directory: This lesson assumes that you have set your working
directory to the location of the downloaded and unzipped data subsets. An overview
of setting the working directory in R can be found here..
R Script & Challenge Code: NEON data lessons often contain challenges that reinforce
learned skills. If available, the code for challenge solutions is found in the
downloadable R script of the entire lesson, available in the footer of each lesson page.
Additional Resources
- Wikipedia article on GIS file formats.
Get Started With Your Project - File Organization
When we work with large, spatio-temporal data, it is a good idea to store large data sets in a general data directory that you can easily access from many projects. If you are working in a collaborative environment, use a shared data directory.
One Dataset - Many Files
While text files often are self contained (one CSV) is composed of one unique file, many spatial formats contain several files. For instance, a shapefile (discussed below) contains 3 or more files, all of which must retain the same NAME and be stored in the same file directory, in order for you to be able to work with them. We will discuss these issues as they related to two key spatial data formats - .shp (shapefile) which stores vector data and .tif (geotiff) which stores raster data in more detail, below.
Types of Spatial Data
Spatial data are represented in many different ways and are stored in different file formats. In this tutorial, we will focus on the two types of spatial data: raster and vector data.
Vector Data - Points, Lines, Polygons
Vector data, are often used to store things like road and plot locations, boundaries of states, countries and lakes.
Vector data are composed of discrete geometric locations (x,y values) known as vertices that define the “shape” of the spatial object. The organization of the vertices determines the type of vector that we are working with: point, line or polygon.
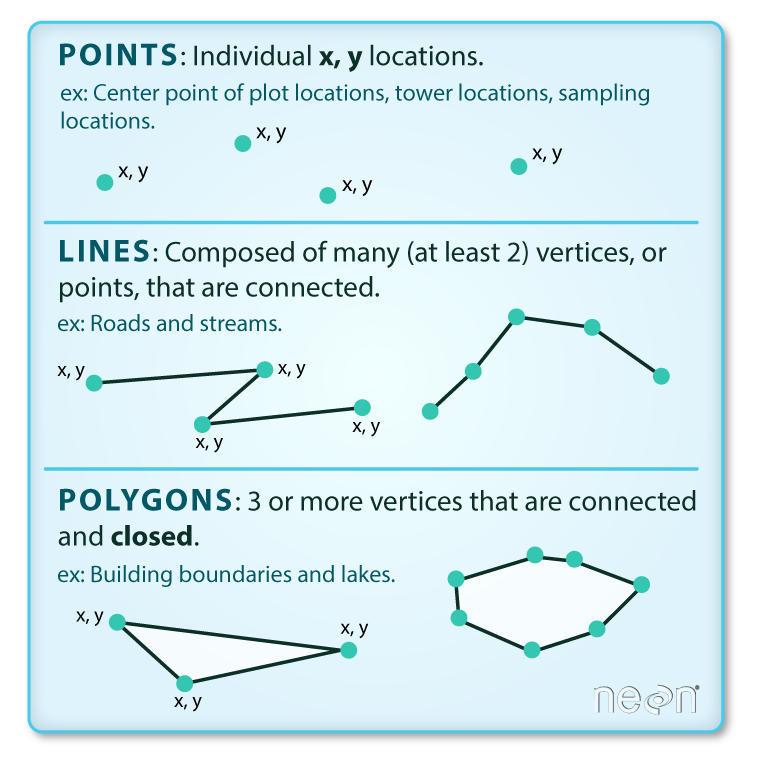
- Points: Each individual point is defined by a single x, y coordinate.
There can be many points in a vector point file. Examples of point data include:
- sampling locations,
- the location of individual trees or
- the location of plots.
- Lines: Lines are composed of many (at least 2) vertices that
are connected. For instance, a road or a stream may be represented by a line.
This line is composed of a series of segments, each “bend” in the road or stream
represents a vertex that has defined
x, ylocation. - Polygons: A polygon consists of 3 or more vertices that are connected
and “closed”. Occasionally, a polygon can have a hole in the middle of it
(like a doughnut), this is something to be aware of but not an issue we will
deal with in this tutorial series. Objects often represented by polygons
include:
- outlines of plot boundaries,
- lakes,
- oceans and
- states or country boundaries.
Data Tip: A shapefile will only contain one type of vector data: points, lines or polygons.
# load libraries required to work with spatial data
library(raster) # commands to view metadata from vector objects
library(rgdal) # library of common GIS functions

# Open shapefile
roads_HARV <- readOGR("NEON-DS-Site-Layout-Files/HARV","HARV_roads")

## Error in ogrInfo(dsn = dsn, layer = layer, encoding = encoding, use_iconv = use_iconv, : Cannot open data source

# view slots available for the object
slotNames(roads_HARV)

## Error in is(x, "classRepresentation"): object 'roads_HARV' not found

# view all methods available for that object
# methods(class = class(roads_HARV))
Stucture of a Lines Feature
If we are working with a shapefile containing line data, then each line
consists of 2 or more vertices that are connected. We can view each set of coordinates
for that object using R.
# view the coordinates for each vertex, for the last feature in the spatial object
roads_HARV@lines[13]

## Error in eval(expr, envir, enclos): object 'roads_HARV' not found

# view the coordinates for the last feature in the spatial object
roads_HARV@lines[14]

## Error in eval(expr, envir, enclos): object 'roads_HARV' not found
Question - Why didn’t roads_HARV@lines[14] return any vertex coordinates?
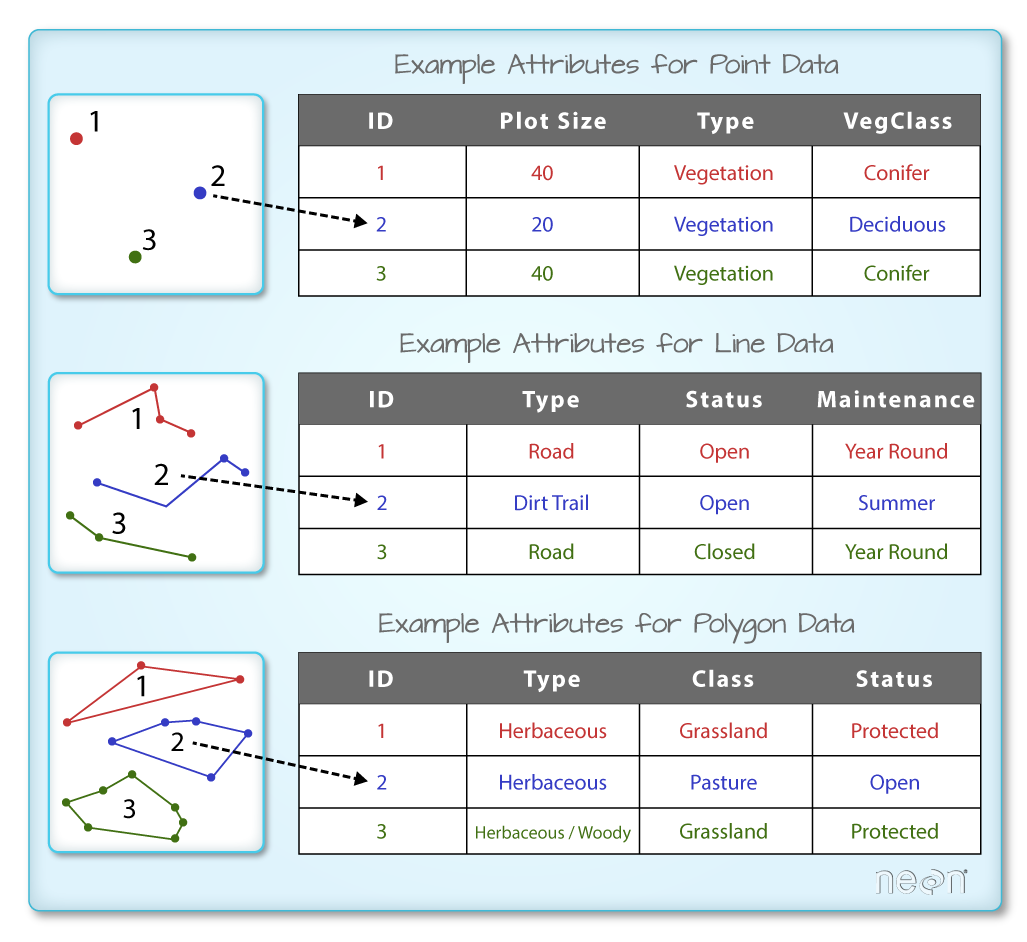
Spatial Data Attributes
Each object in a shapefile, is called a feature. Each feature has one or
more attributes associated with it.
Shapefile attributes are similar to fields or columns in a spreadsheet. Each row
in the spreadsheet has a set of columns associated with it that describe the row
element. In the case of a shapefile, each row represents a spatial object - for
example, a road, represented as a line in a line shapefile, will have one “row”
of attributes associated with it. These attributes can include different types
of information that describe shapefile features. Thus, a road,
may have a name, length, number of lanes, speed limit, type of road and other
attributes stored with it.
# view all attributes for a spatial object
# note, the code below just looks at the first 3 features
head(roads_HARV@data, 3)

## Error in head(roads_HARV@data, 3): object 'roads_HARV' not found
In the map below of the Harvard Forest field site, there are many different features with different spatial object types. We will learn to create maps like this in the Introduction to Working with Vector Data in R tutorial series.
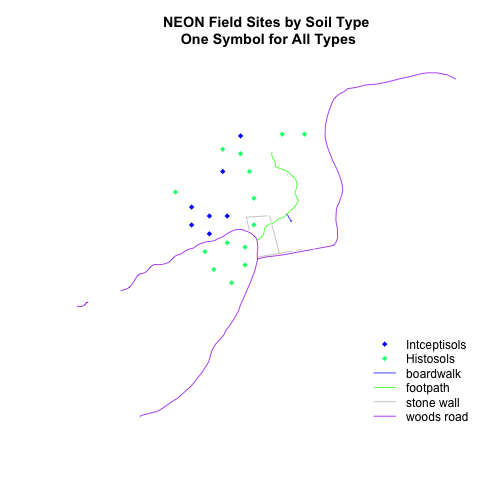
Challenge: Shapefiles
Have a look at the map above: Study Plots by Soil Type. What is the minimum number of shapefiles that are required to create this map? How do you know?
Shapefile Structure
When working with shapefiles, it is important to remember that a shapefile consists of 3 (or more) files:
.shp: the file that contains the geometry for all features..shx: the file that indexes the geometry..dbf: the file that stores feature attributes in a tabular format.
These files need to have the same name and to be stored in the same
directory (folder) to open properly in a GIS, R or Python tool.
Sometimes, a shapefile will have other associated files including:
.prj: the file that contains information on projection format including the coordinate system and projection information. It is a plain text file describing the projection using well-known text (WKT) format..sbnand.sbx: the files that are a spatial index of the features..shp.xml: the file that is the geospatial metadata in XML format, (e.g. ISO 19115 or XML format).
Data Management - Sharing Shapefiles
When you work with a shapefile, you must keep all of the key associated file types together. And when you share a shapefile with a colleague, it is important to zip up all of these files into one package before you send it to them!
We cover working with shapefiles in R in the
Introduction to Working With Vector Data in R series.
Vector Data in .CSV Format
The shapefile format is one (very common) way to store vector data. However, you may encounter is in other formats. For example, sometimes, point data are stored as a Comma Separated Value (.CSV) format.
We cover working with vector points in .csv format in the tutorial: Convert from .csv to a Shapefile in R..
Raster Data
Raster or “gridded” data are saved on a uniform grid and rendered on a map as pixels. Each pixel contains a value that represents an area on the Earth’s surface.
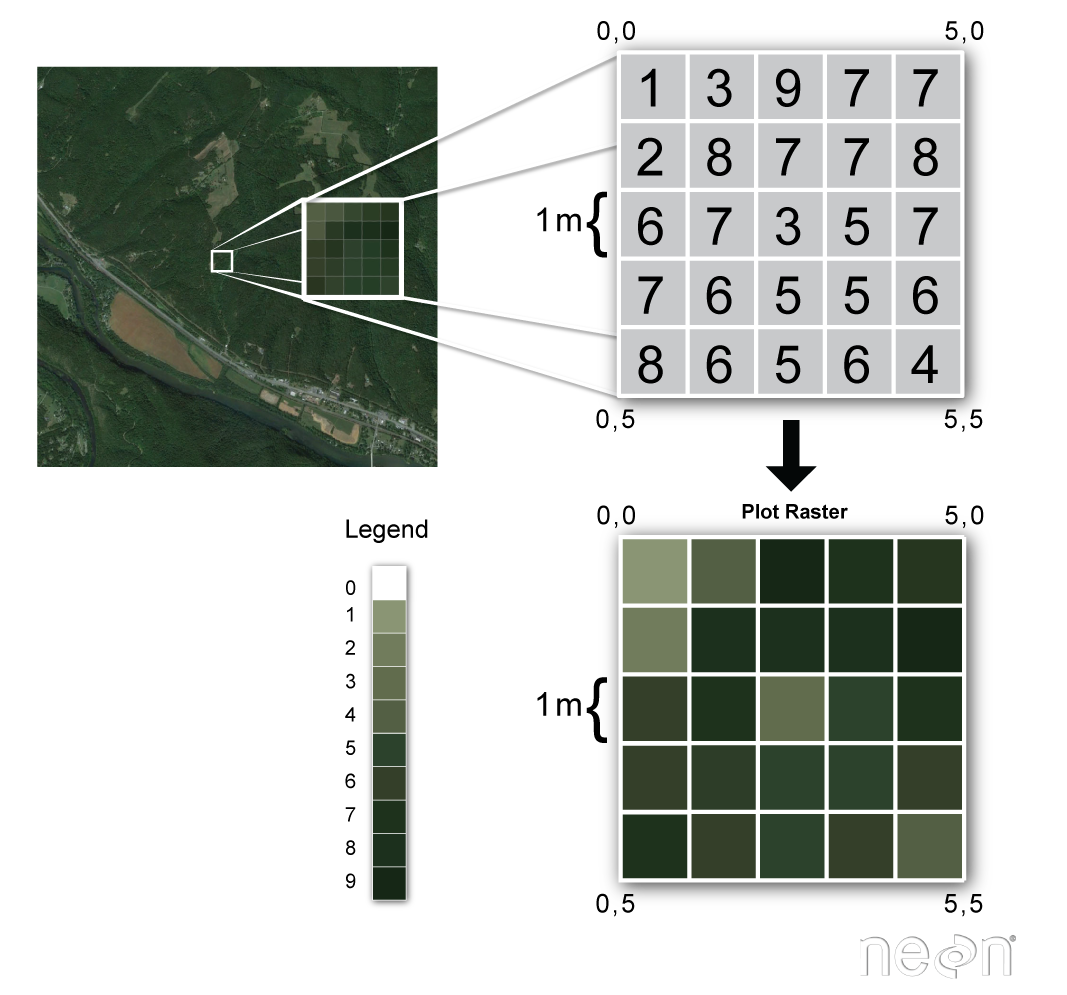
GeoTIFF
There are many different raster data file formats. In this tutorial series, we
will focus on the GeoTIFF. The GeoTIFF format is similar to the .tif
format, however the GeoTIFF format stores additional spatial metadata.
# view attributes for a geotif file
GDALinfo("NEON-DS-Airborne-Remote-Sensing/HARV/CHM/HARV_chmCrop.tif")

## Error in .local(.Object, ...):

# import geotiff
chm_HARV <- raster("NEON-DS-Airborne-Remote-Sensing/HARV/CHM/HARV_chmCrop.tif")

## Error in .rasterObjectFromFile(x, band = band, objecttype = "RasterLayer", : Cannot create a RasterLayer object from this file. (file does not exist)

chm_HARV

## Error in eval(expr, envir, enclos): object 'chm_HARV' not found
Metadata in .tif Files
The tif and GeoTIFF formats stores metadata as embedded tif tags. These
tags can include the following raster metadata:
- A Coordinate Reference System (
CRS) - Spatial Extent (
extent) - Values for when no data is provided (
NoData Value) - The
resolutionof the data
We will explore metadata in tif files in the next, tutorial - Spatial Intro 03: Data About Data – Intro to Metadata File Formats and Structure
IMPORTANT: just because a .tif file can store metadata tags, doesn’t mean
that metadata are always included! If the data creator doesn’t actively add
.tif tags, then they may not be there for us to use.
Metadata - Saving .tif Files in R
In R, and many other GIS tools, it’s important to ensure that .tif tags
are properly saved when you export a .tif. For example, when using the
writeRaster()function in R, if you do not specify the NA (noData) value
when you export a GeoTIFF, it will default to a different value which could be
read incorrectly in other programs!
# if you want a NA value of -9999, then you have to specify this when you
# export a raster file in R
exampleRaster <- writeRaster(rasterObject,  # object to export/write
                             FileName.tif,  # name of new .tif file
                             datatype = "INT1U",  # the data type
                             NAflag = -9999)  # your desired NA or noData value
We cover writing NA values using the writeRaster function in R in
Raster Calculations in R - Subtract One Raster from Another and Extract Pixel Values For Defined Locations tutorial.
Data Note: Tif tags - metadata tags stored
within a tif or GeoTIFF file are also what your camera uses to store
information about how and when a picture was taken! And how your computer reads
this metadata and identifies, for example, the make and model of the camera or
the date the photo was taken.
Other Raster File Formats
- .asc: A comma separated text file with a spatial heading.
- Hierarchical Data Format (HDF5): An open file format that supports large, complex, heterogeneous data. More on HDF5 formated rasters can be found in the NEON Data Skills tutorials focusing on HDF5.
- .grd: An ESRI specific raster format.
- netCDF:
- GRIB: What is Grib?