


Reviewers:
Overview
About
This tutorial focuses on the Universal Trans Mercator (UTM) projected Coordinate Reference which divides the globe into zones to optimize projection results in each zone. It also briefly introduces the concept of a datum.
R Skill Level: Beginner - you’ve got the basics of R down.
Goals / Objectives
After completing this activity, you will:
- The basic difference between a
Geographicand aProjectedCoordinate Reference System. - Become familiar with the Universal Trans Mercator (UTM) and Geographic (WGS84) CRSs
Things You’ll Need To Complete This Lesson
To complete this lesson you will need the most current version of R, and
preferably, RStudio loaded on your computer.
Install R Packages
- NAME:
install.packages("NAME")
More on Packages in R - Adapted from Software Carpentry.
Download Data
If you want to follow along, please download
Download Natural Earth Global Boundary Layer
Set Working Directory: This lesson assumes that you have set your working
directory to the location of the downloaded and unzipped data subsets. An overview
of setting the working directory in R can be found here..
R Script & Challenge Code: NEON data lessons often contain challenges that reinforce
learned skills. If available, the code for challenge solutions is found in the
downloadable R script of the entire lesson, available in the footer of each lesson page.
Spatial-Temporal Data & Data Management Lesson Series: This lesson is part
of a lesson series introducing
spatial data and data management in R .
It is also part of a larger
spatio-temporal Data Carpentry Workshop
that includes working with
raster data in R ,
vector data in R
and
tabular time series in R .
Additional Resources
- Read more on coordinate systems in the QGIS documentation.
- NEON Data Skills Lesson The Relationship Between Raster Resolution, Spatial extent & Number of Pixels - in R
Geographic vs Projected CRS
In the previous tutorial, we explored, two different types of Coordinate Reference Systems:
- Geographic coordinate systems: coordinate systems that span the entire globe (e.g. latitude / longitude).
- Projected coordinate Systems: coordinate systems that are localized to minimize visual distortion in a particular region (e.g. Robinson, UTM, State Plane)
In this tutorial, we will discuss the differences between these CRSs in more detail.
Geographic Coordinate Systems
A geographic coordinate system uses a grid that wraps around the entire globe.
This means that each point on the globe is defined using the SAME coordinate system. Geographic coordinate systems are best for global analysis however it
is important to remember that distance is distorted using a geographic lat / long
CRS.
The geographic WGS84 lat/long CRS has an origin - (0,0) -
located at the intersection of the
Equator (0° latitude) and Prime Meridian (0° longitude) on the globe.
## Error in ogrInfo(dsn = dsn, layer = layer, encoding = encoding, use_iconv = use_iconv, : Cannot open data source

## Error in fortify(worldGrat30): object 'worldGrat30' not found

## Error in ogrInfo(dsn = dsn, layer = layer, encoding = encoding, use_iconv = use_iconv, : Cannot open data source

## Error in fortify(wgs84Box): object 'wgs84Box' not found

## Error in ggplot(wgs84Box_df, aes(long, lat, group = group)): object 'wgs84Box_df' not found
Data Note: The distance between the 2 degrees of longitude at the equator (0°) is ~ 69 miles. The distance between 2 degrees of longitude at 40°N (or S) is only 53 miles. However measures of distance when using lat/long project are not uniform.
Projected Coordinate Reference Systems
Spatial projection refers to the mathematical calculations performed to flatten the 3D data onto a 2D plane (our computer screen or a paper map). Projecting data from a round surface onto a flat surface, results in visual modifications to the data when plotted on a map. Some areas are stretched and some some are compressed. We can see this when we look at a MAP of the entire globe.
The mathematical calculations used in spatial projections are designed to optimize the relative size and shape of a particular region on the globe.

About UTM
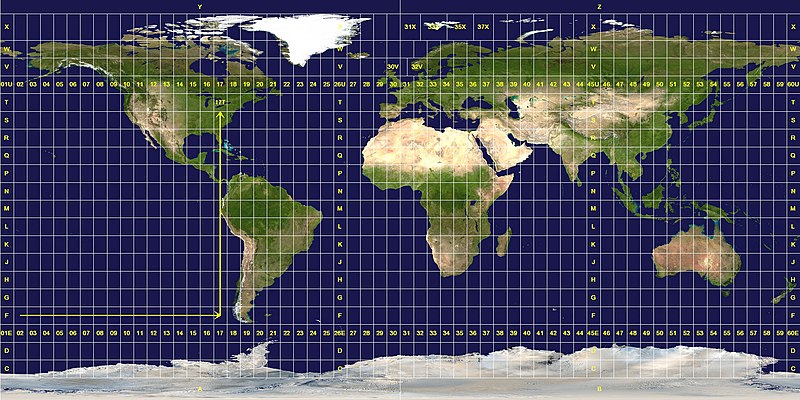
The Universal Transverse Mercator (UTM) system is a commonly used projected coordinate reference system. UTM subdivides the globe into zones, numbered 0-60 (equivalent to longitude) and regions (north and south)
Data Note: UTM zones are also defined using bands, lettered C-X (equivalent to latitude) however, the band designation is often dropped as it isn’t esssential to specifying the location.
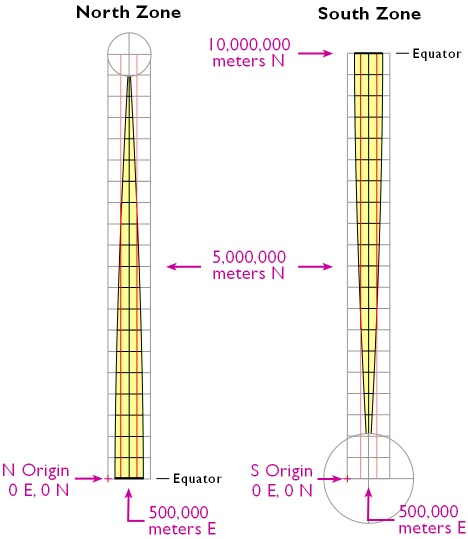
While UTM zones span the entire globe, UTM uses a regional projection and associated coordinate system. The coordinate system grid for each zone is projected individually using the Mercator projection.
The origin (0,0) for each UTM zone and associated region is located at the intersection of the equator and a location, 500,000 meters east of the central meridian of each zone. The origin location is placed outside of the boundary of the UTM zone, to avoid negative Easting numbers.
More on UTM
edit this messy
The coordinates for the NEON Harvard Forest Field Site would be written as:
UTM Zone 18N, 730782m, 4712631m
where the N denotes that it is in the Northern, not Southern hemisphere. Occassionally, you may see:
Zone 18T, 730782m Easting, 4712631m Northing.
Data Tip: The UTM system doesn’t apply to polar regions (>80°N or S). Universal Polar Stereographic (UPS) coordinate system is used in these area. This is where zones A, B and Y, Z are used if you were wondering why they weren’t in the UTM lettering system.
Practice understanding UTM coordinates:
https://www.e-education.psu.edu/natureofgeoinfo/sites/www.e-education.psu.edu.natureofgeoinfo/files/flash/coord_practice_utm_v06.swf
Datum
The datum describes the vertical and horizontal reference point of the coordinate system. The vertical datum describes the relationship between a specific ellipsoid (the top of the earth’s surface) and the center of the earth. The datum also describes the origin (0,0) of a coordinate system.
Frequently encountered datums:
- WGS84 – World Geodetic System (created in) 1984. The origin is the center of the earth.
- NAD27 & NAD83 – North American Datum 1927 and 1983, respectively. The origin for NAD 27 is Meades Ranch in Kansas.
- ED50 – European Datum 1950
For more information, read
NOTE: All coordinate reference systems have a vertical and horizontal datum which defines a “0, 0” reference point. There are two models used to define the datum: ellipsoid (or spheroid): a mathematically representation of the shape of the earth. Visit Wikipedia’s article on the earth ellipsoid for more information and geoid: a model of the earth’s gravitatinal field which approximates the mean sea level across the entire earth. It is from this that elevation is measured. Visit Wikipedia’s geoid article for more information. We will not cover these concepts in this tutorial.
Coordinate Reference System Formats
There are numerous formats that are used to document a CRS. In the next tutorial we will discuss three of the commonly encountered formats including: Proj4, WKT (Well Known Text) and EPSG.
Additional Resources
ESRI help on CRS QGIS help on CRS NCEAS cheatsheets