Selected observations and variables from U.S. Geological Survey water quality stations in south San Francisco Bay. Data include CTD and nutrient measurements.
Format
sfbay is a data frame with 23207 observations (rows) of 12
variables (columns):
[, 1] | date | date |
[, 2] | time | time |
[, 3] | stn | station code |
[, 4] | depth | measurement depth |
[, 5] | chl | chlorophyll a |
[, 6] | dox.pct | dissolved oxygen |
[, 7] | spm | suspended particulate matter |
[, 8] | ext | extinction coefficient |
[, 9] | sal | salinity |
[, 10] | temp | water temperature |
[, 11] | nox | nitrate + nitrite |
[, 12] | nhx | ammonium |
sfbayStns is a data frame with 16 observations of 6 variables:
[, 1] | site | station code |
[,
2] | description | station description |
[, 3] | lat | latitude |
[, 4] | long | longitude |
[, 5] | depthMax | maximum depth, in m |
[, 6] | distFrom36 | distance from station 36, in km |
sfbayVars is a data frame with 7 observations of 3 variables:
[, 1] | variable | water quality variable code |
[, 2] | description | description |
[,
3] | units | measurement units |
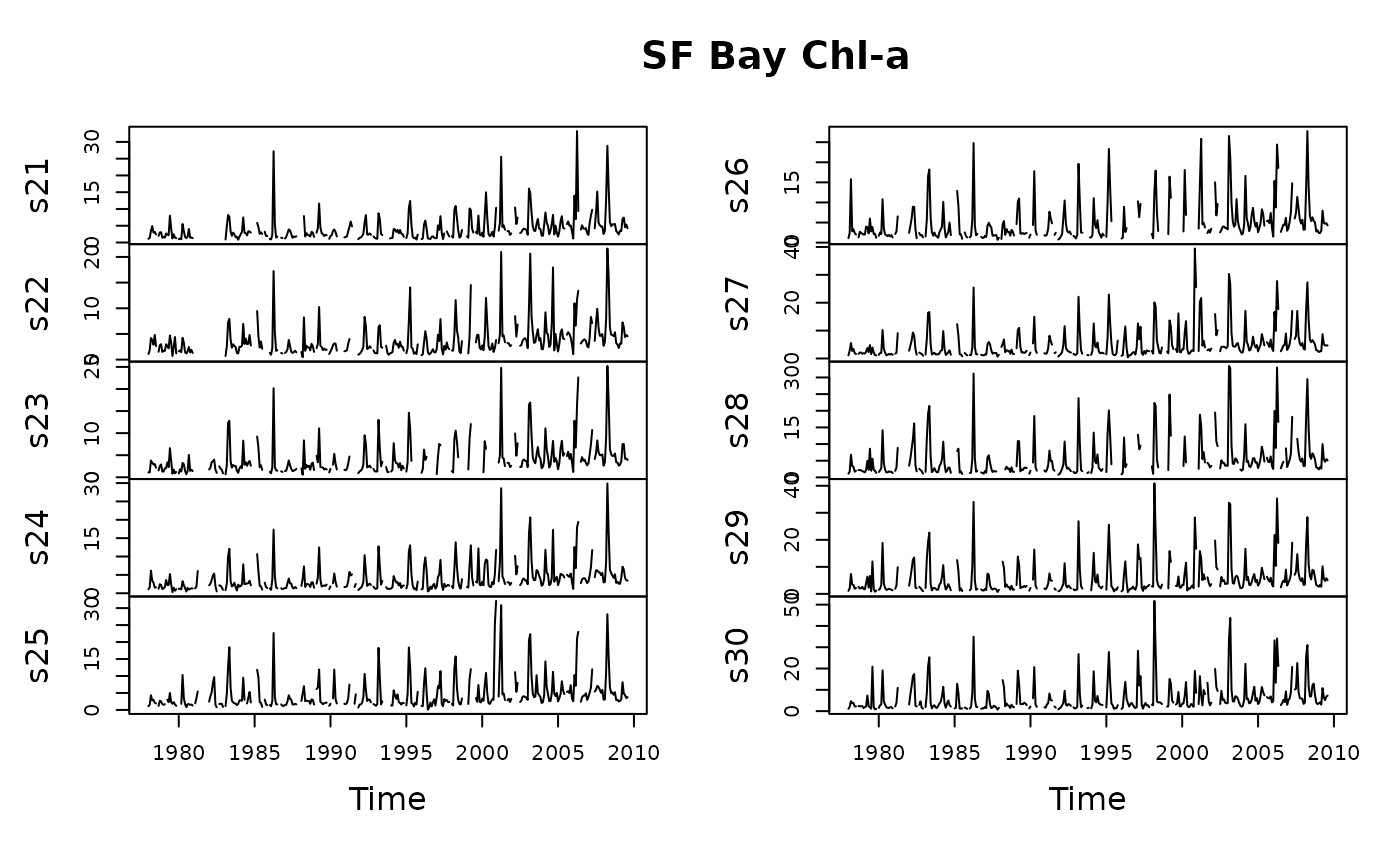
sfbayChla is a time series matrix (380 months x 16 stations)
of average 0-5 m chlorophyll a concentrations calculated from the
data in sfbay.
Source
Downloaded from USGS on 2009-11-17.
Details
The original downloaded dataset was modified by taking a subset of six
well-sampled stations and the period 1985--2004. Variable names were also
simplified. The data frames sfbayStns and sfbayVars describe
the stations and water quality variables in more detail; they were created
from information at the same web site. Note that the station numbers in
sfbayStns have been prefixed with s to make station codes into
legal variable names. sfbayChla was constructed from the entire
downloaded sfbay dataset and encompasses the period 1969--2009.
Examples
data(sfbay)
str(sfbay)
#> 'data.frame':	23207 obs. of  12 variables:
#>  $ date : chr  " 1/23/1985" " 1/23/1985" " 1/23/1985" " 1/23/1985" ...
#>  $ time : int  1120 1120 1120 1120 1222 1222 1222 1324 1324 1324 ...
#>  $ stn  : num  21 21 21 21 24 24 24 27 27 27 ...
#>  $ depth: num  1 2 6 12 1 2 9 1 2 12 ...
#>  $ chl  : num  5.6 3.4 3.1 3.4 6.2 5.6 3.3 NA NA NA ...
#>  $ dox  : num  NA NA NA NA NA NA NA NA NA NA ...
#>  $ spm  : int  17 17 18 21 17 18 23 18 19 21 ...
#>  $ ext  : num  1.6 1.6 1.6 1.9 1.6 1.6 2 1.6 1.7 1.9 ...
#>  $ sal  : num  28.1 28.6 28.9 29.4 27.4 ...
#>  $ temp : num  NA NA NA NA NA NA NA NA NA NA ...
#>  $ nox  : num  NA NA NA NA NA NA NA NA NA NA ...
#>  $ nhx  : num  NA NA NA NA NA NA NA NA NA NA ...
str(sfbayStns)
#> 'data.frame':	16 obs. of  6 variables:
#>  $ site       : Factor w/ 16 levels "s21","s22","s23",..: 1 2 3 4 5 6 7 8 9 10 ...
#>  $ description: chr  "Bay Bridge" "Potrero Point" "Hunter's Point" "Candlestick Point" ...
#>  $ lat        : num  37.8 37.8 37.7 37.7 37.7 ...
#>  $ long       : num  -122 -122 -122 -122 -122 ...
#>  $ depthMax   : num  17.4 18 20.1 11 8.8 9.8 13 16.2 14.6 12.8 ...
#>  $ distFrom36 : Factor w/ 16 levels "0","1.66","10.61",..: 14 13 12 11 10 8 7 6 5 4 ...
#>  - attr(*, "units")=List of 2
#>   ..$ depthMax  : chr "m"
#>   ..$ distFrom36: chr "km"
str(sfbayVars)
#> 'data.frame':	8 obs. of  3 variables:
#>  $ variable   : Factor w/ 8 levels "chl","dox","ext",..: 1 2 7 3 6 8 5 4
#>  $ description: chr  "chlorophyll a" "dissolved oxygen" "suspended particulate matter" "extinction coefficient" ...
#>  $ units      : chr  "mg/m3" "mg/L" "mg/L" "1/m" ...
plot(sfbayChla[, 1:10], main = "SF Bay Chl-a")
