Check Connectivity of a River Network Object
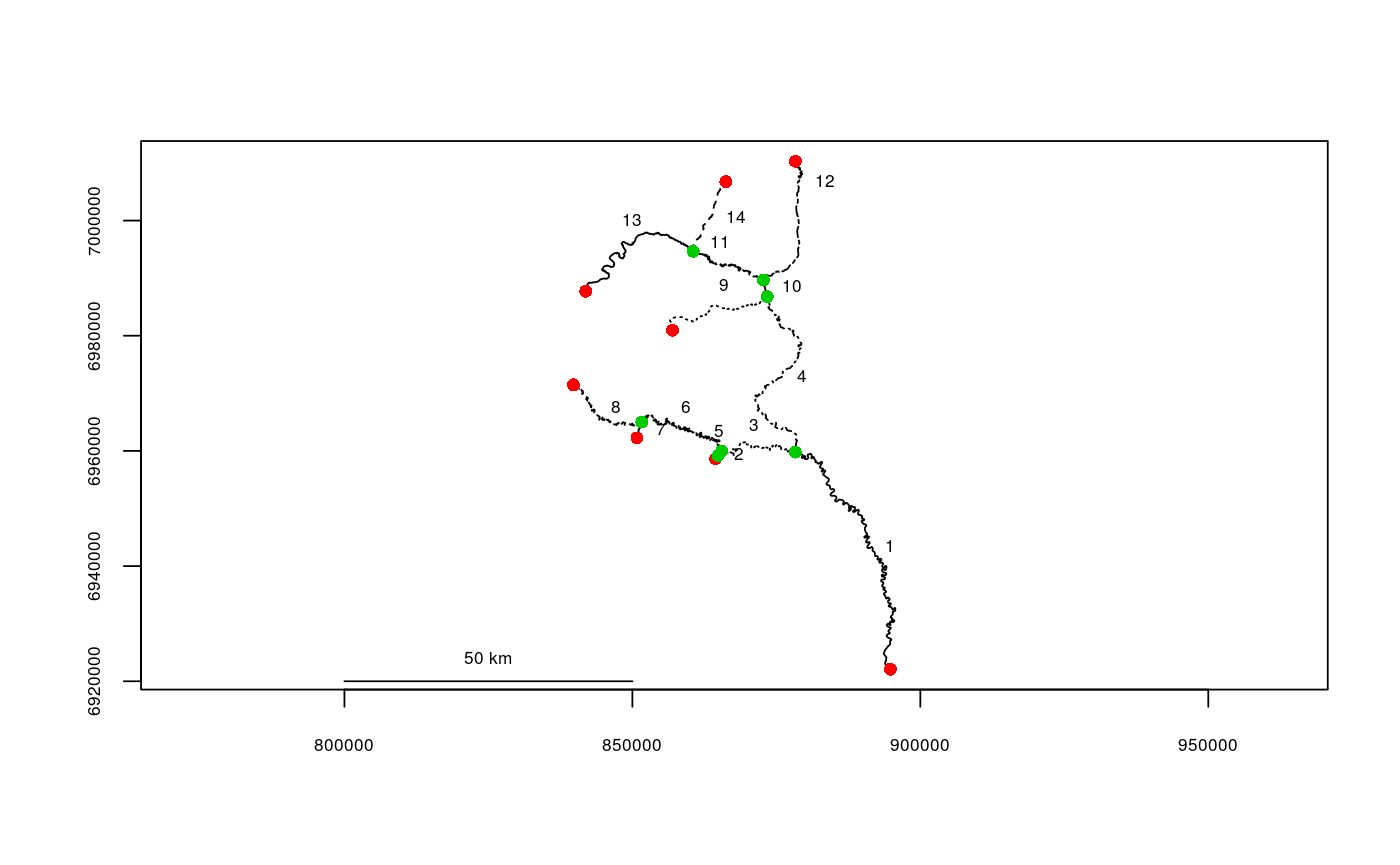
Produces a graphical check of the connectivity of a river network object. It produces a plot of the river network object, and overlays red dots at non-connected endpoints and green dots at connected endpoints.
topologydots(rivers, add = FALSE, ...)
Arguments
| rivers | The river network object to check |
|---|---|
| add | Whether call a new plot ( |
| ... | Additional plotting arguments (see par) |
See also
Examples
data(Gulk)
topologydots(rivers=Gulk)
