Plot Points Used for Kernel Density
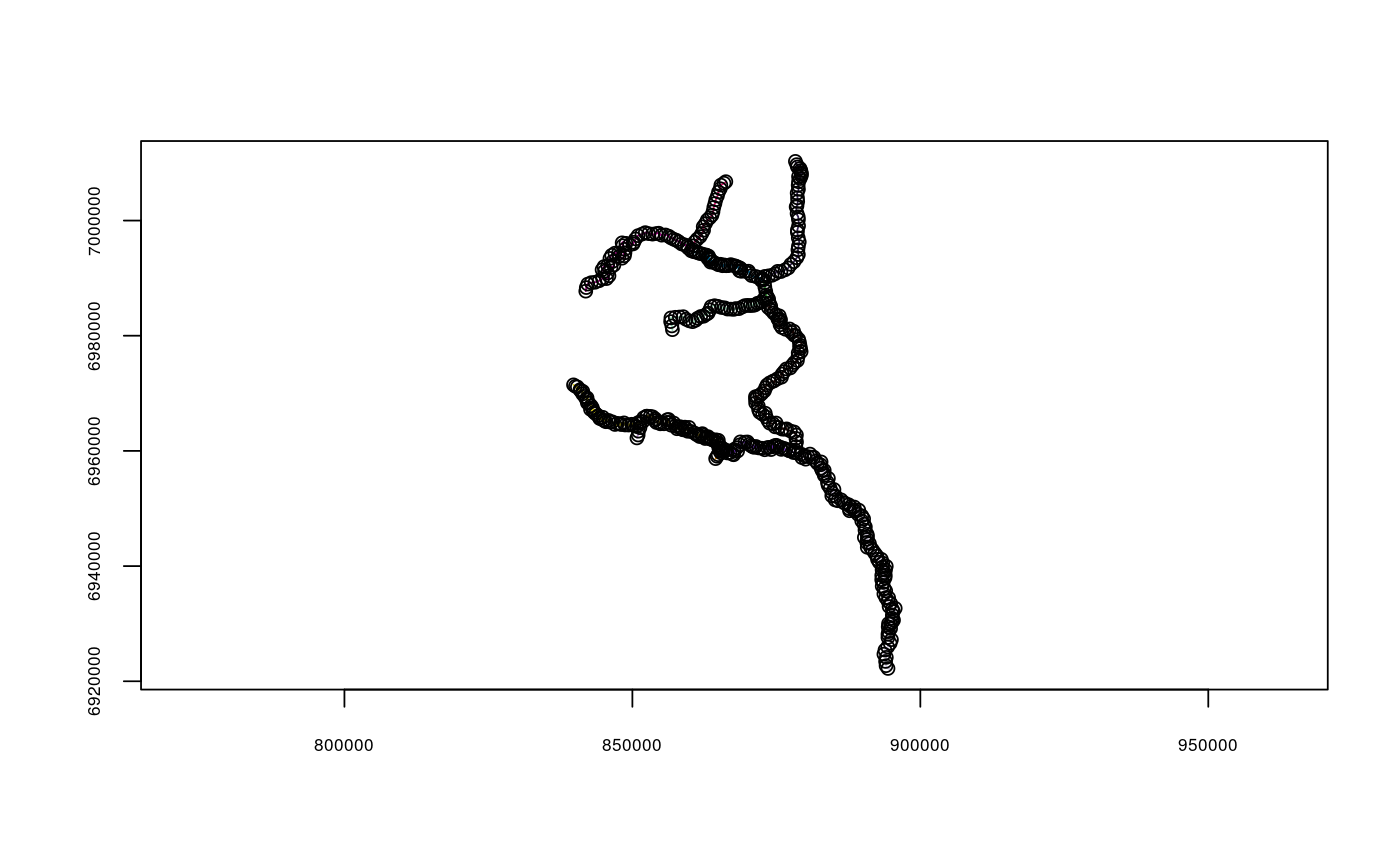
Plots the points used to calculate a kernel density object in makeriverdensity.
This function is intended as a visual check that a sufficient resolution was used.
plotriverdensitypoints(riverdensity)
Arguments
| riverdensity | A river density object created by makeriverdensity. |
|---|
See also
makeriverdensity, plot.riverdensity
Examples
data(Gulk, fakefish) Gulk_dens <- makeriverdensity(seg=fakefish$seg, vert=fakefish$vert, rivers=Gulk)#> | | | 0% | |===== | 7% | |========== | 14% | |=============== | 21% | |==================== | 29% | |========================= | 36% | |============================== | 43% | |=================================== | 50% | |======================================== | 57% | |============================================= | 64% | |================================================== | 71% | |======================================================= | 79% | |============================================================ | 86% | |================================================================= | 93% | |======================================================================| 100%plotriverdensitypoints(riverdensity=Gulk_dens)
