Plotting K-functions for a Set of Surveys
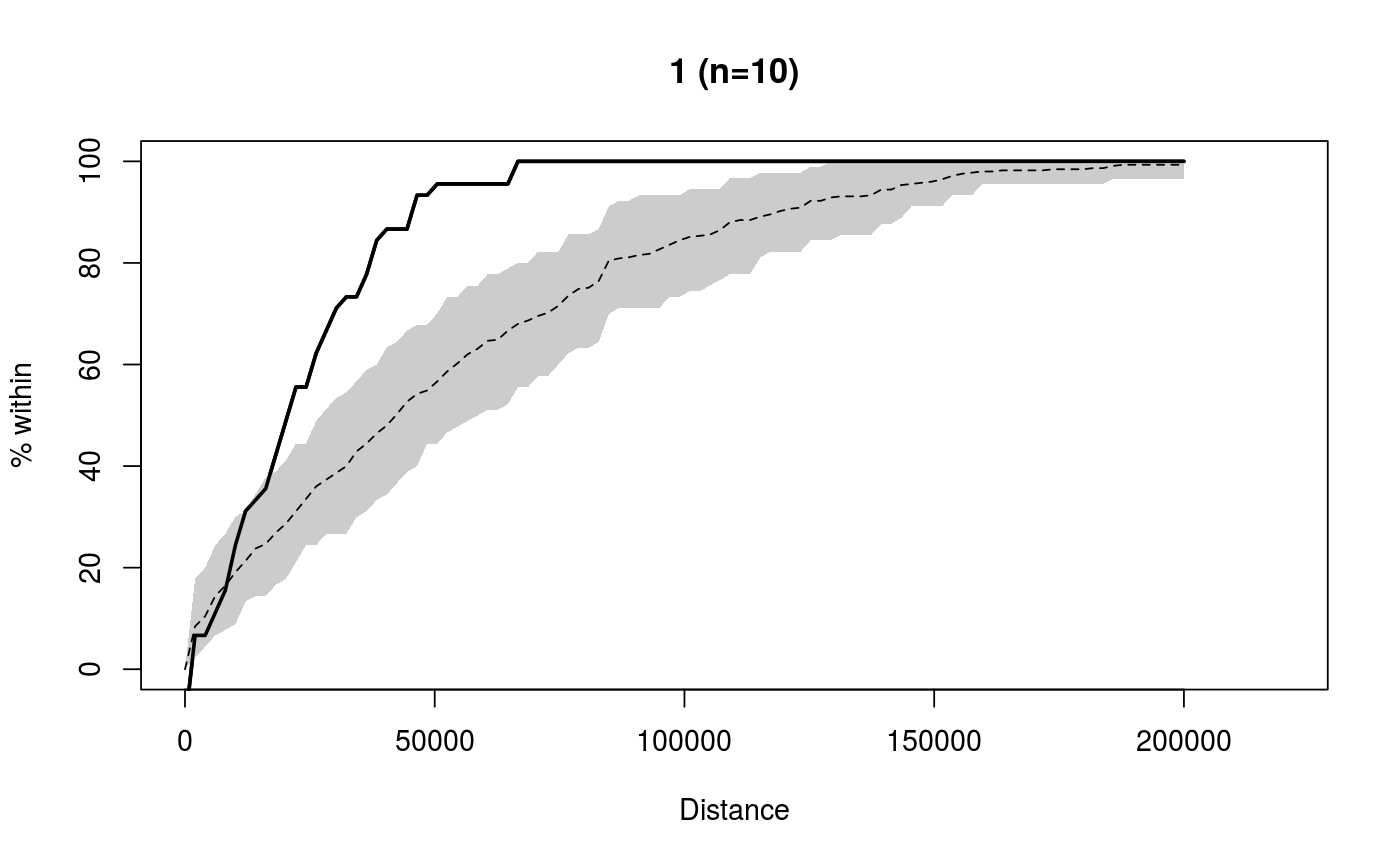
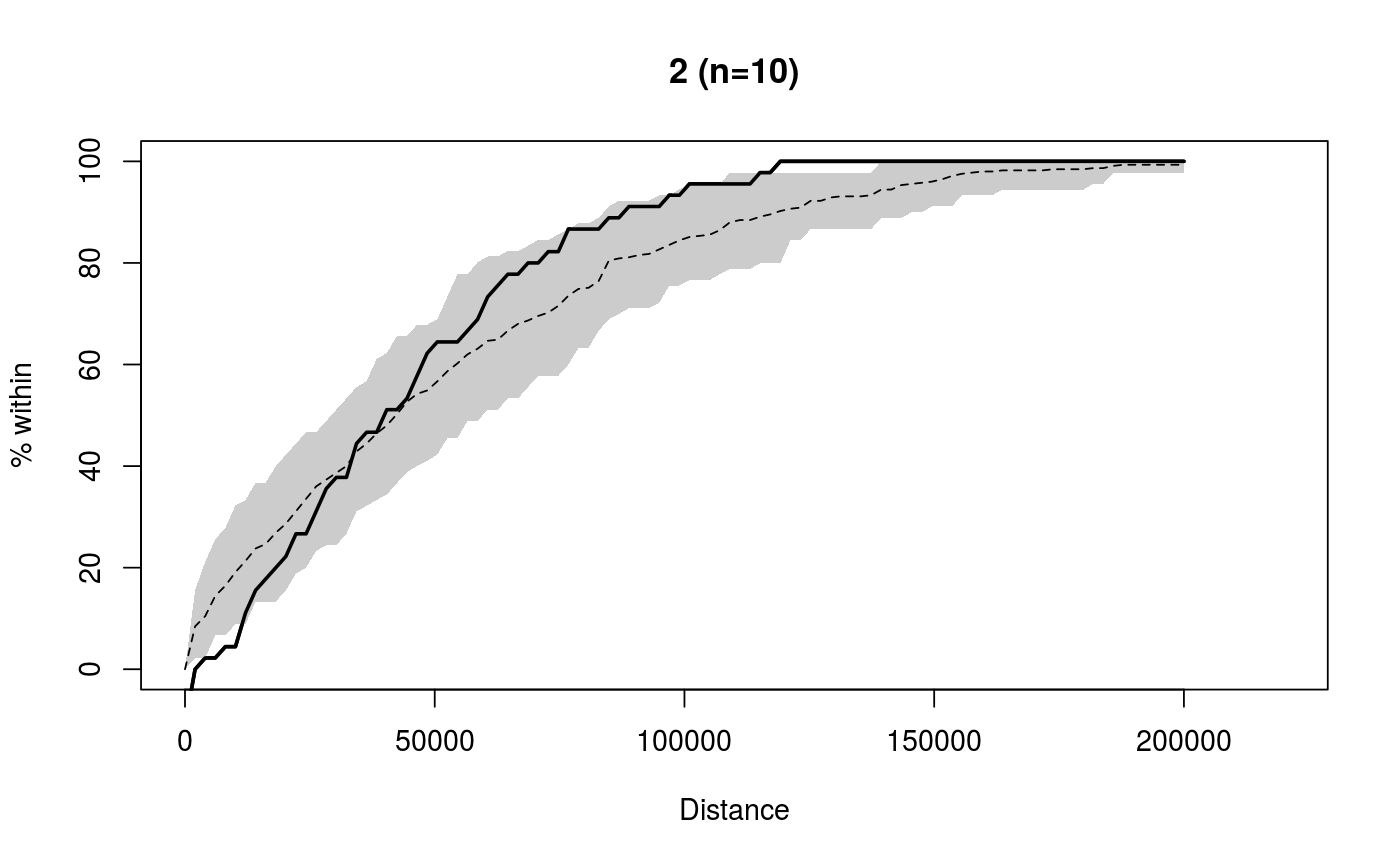
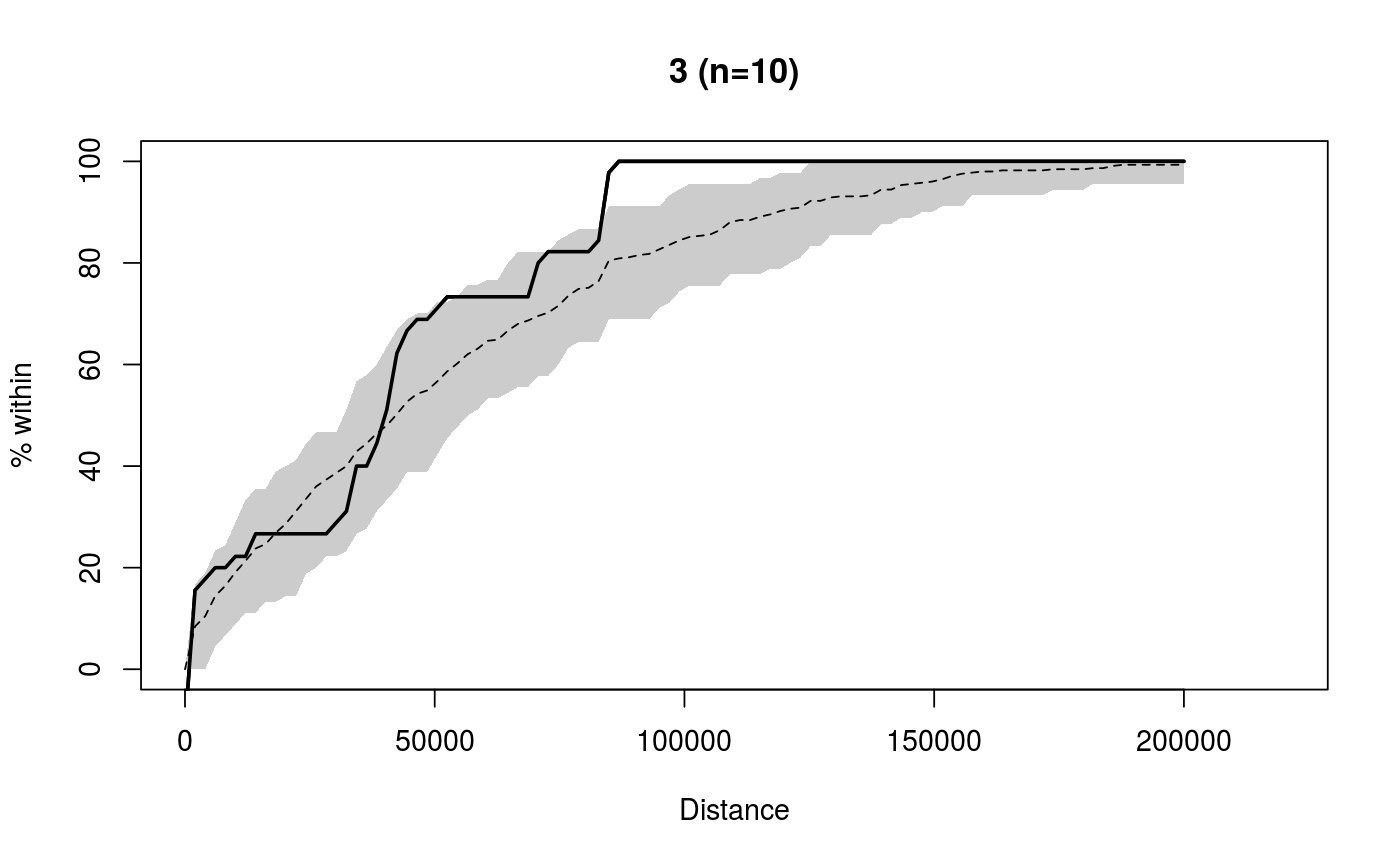
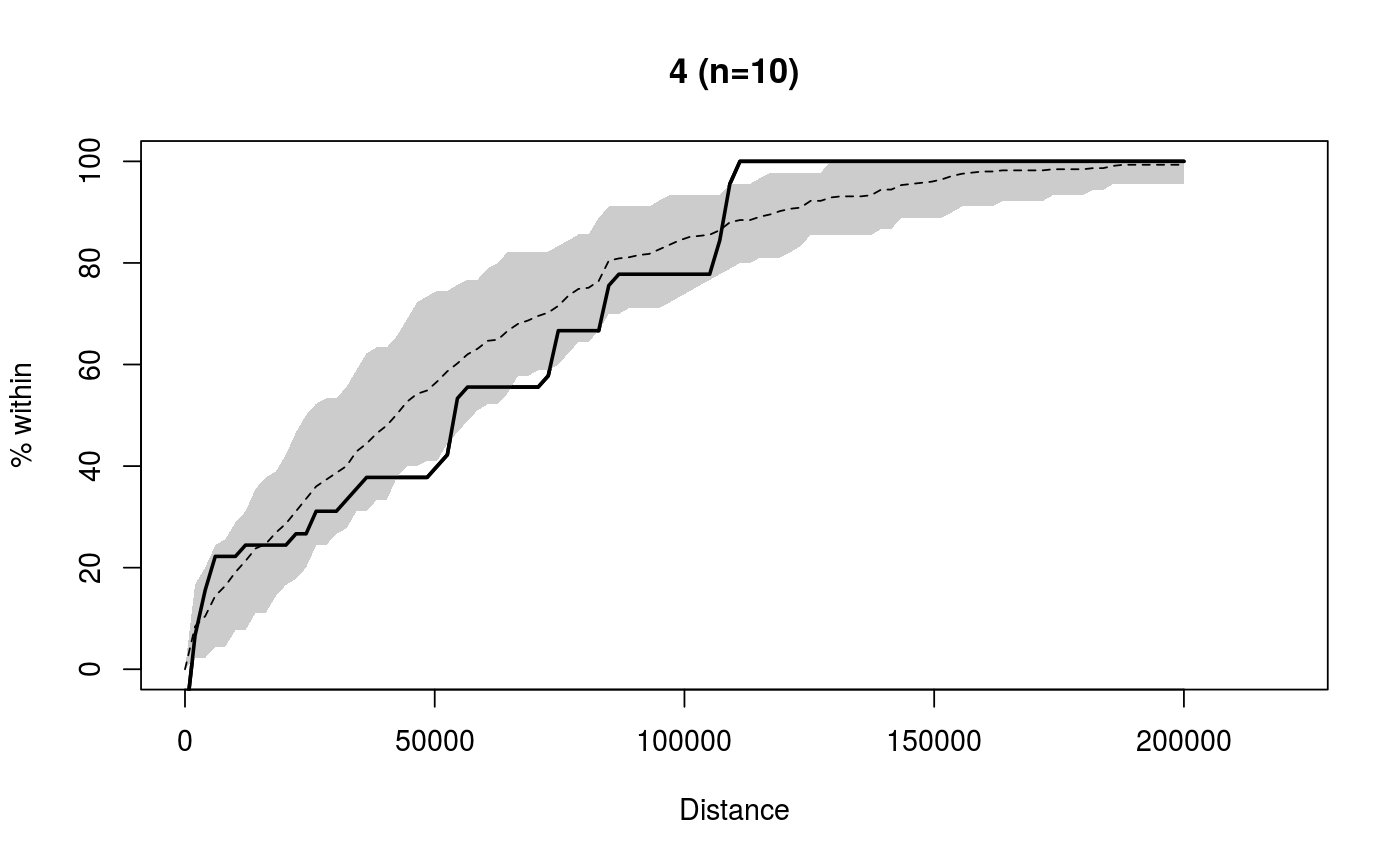
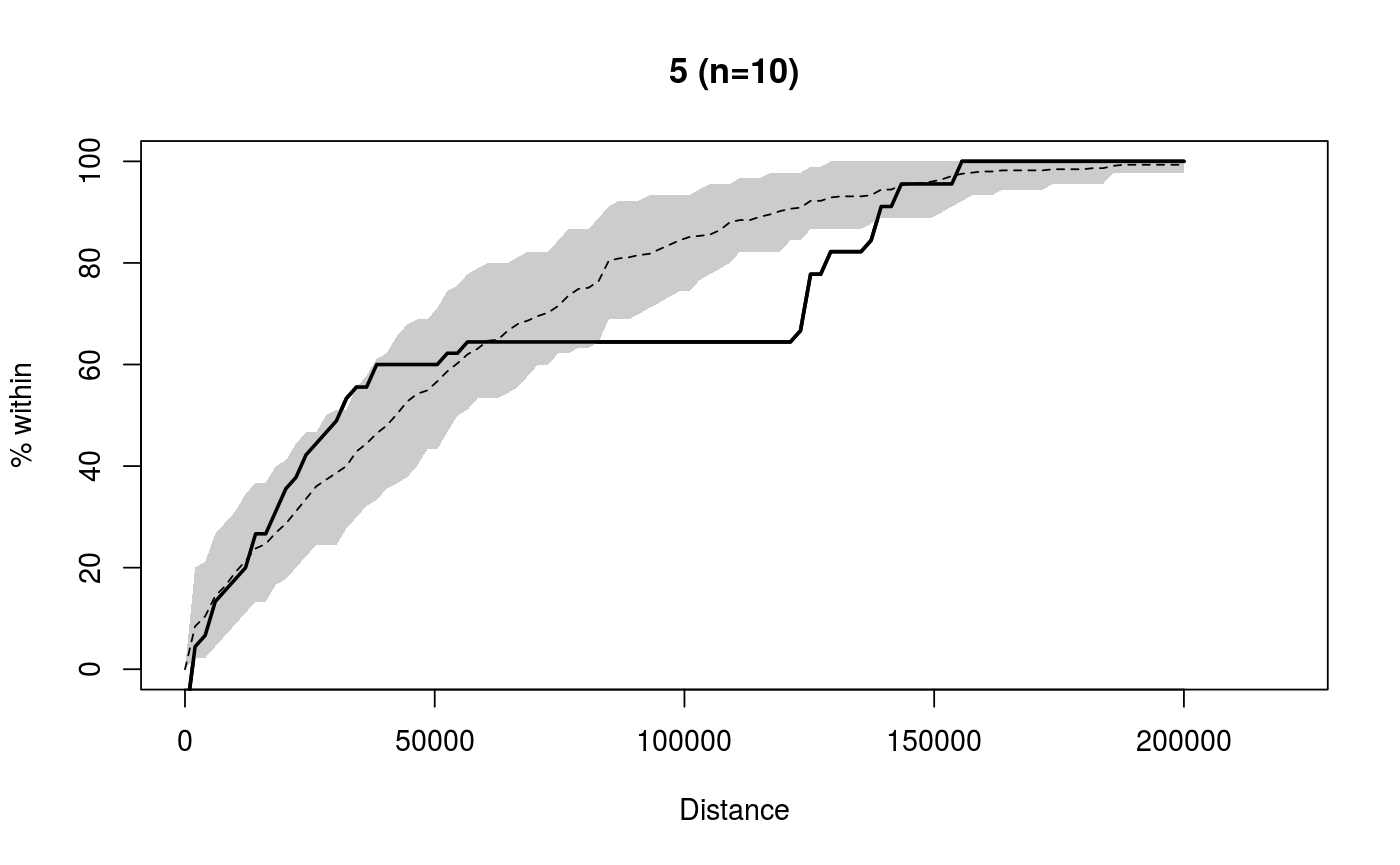
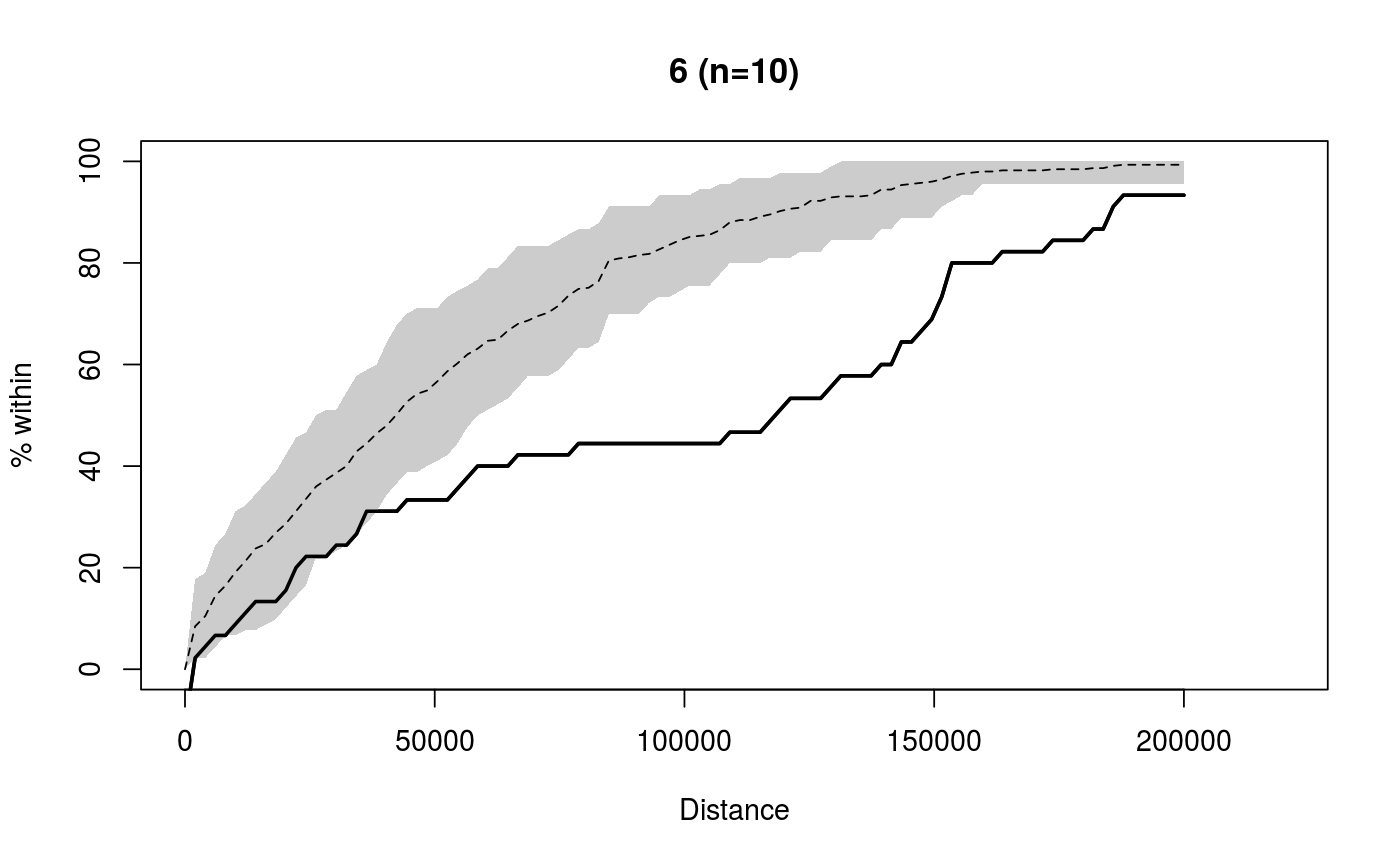
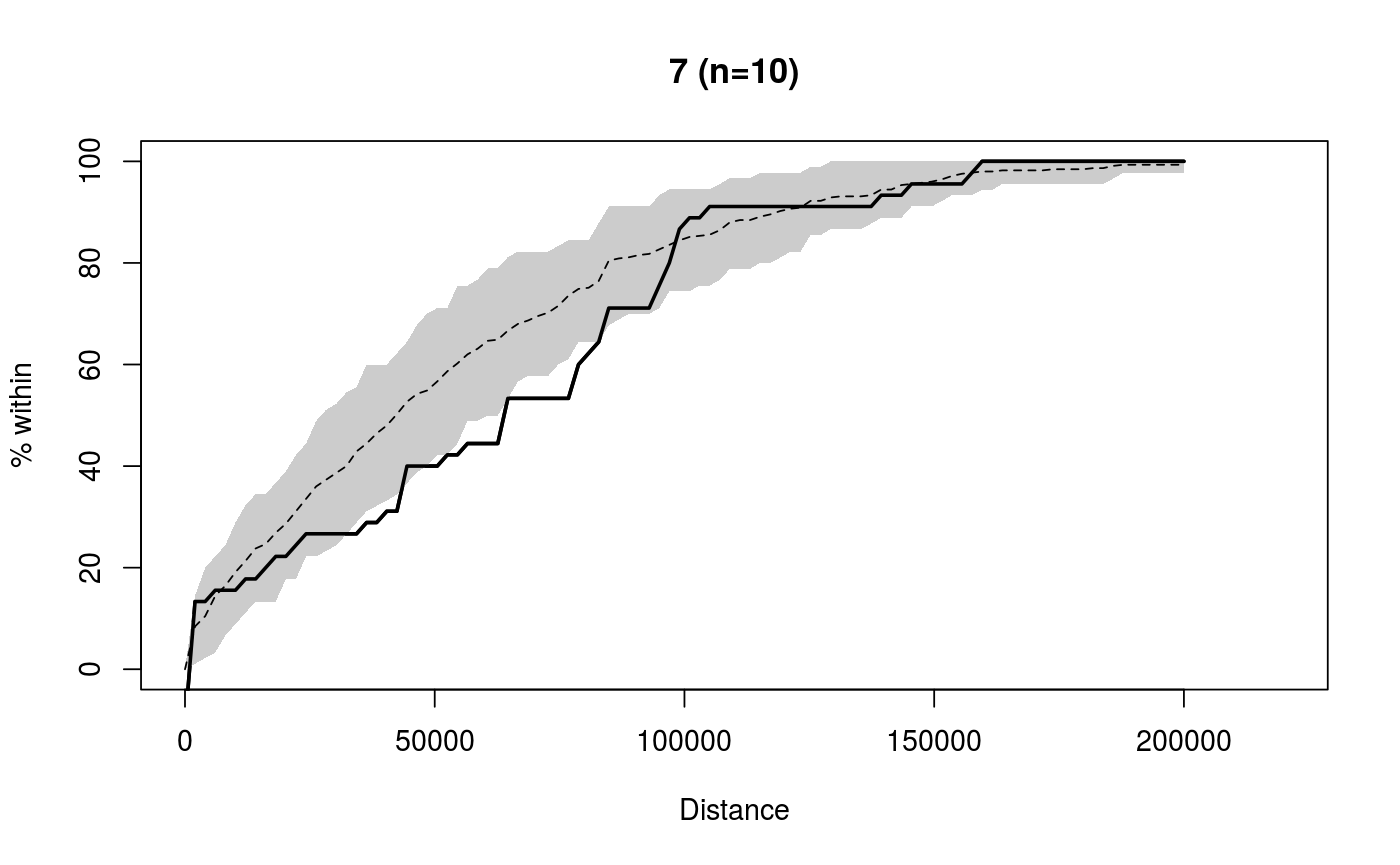
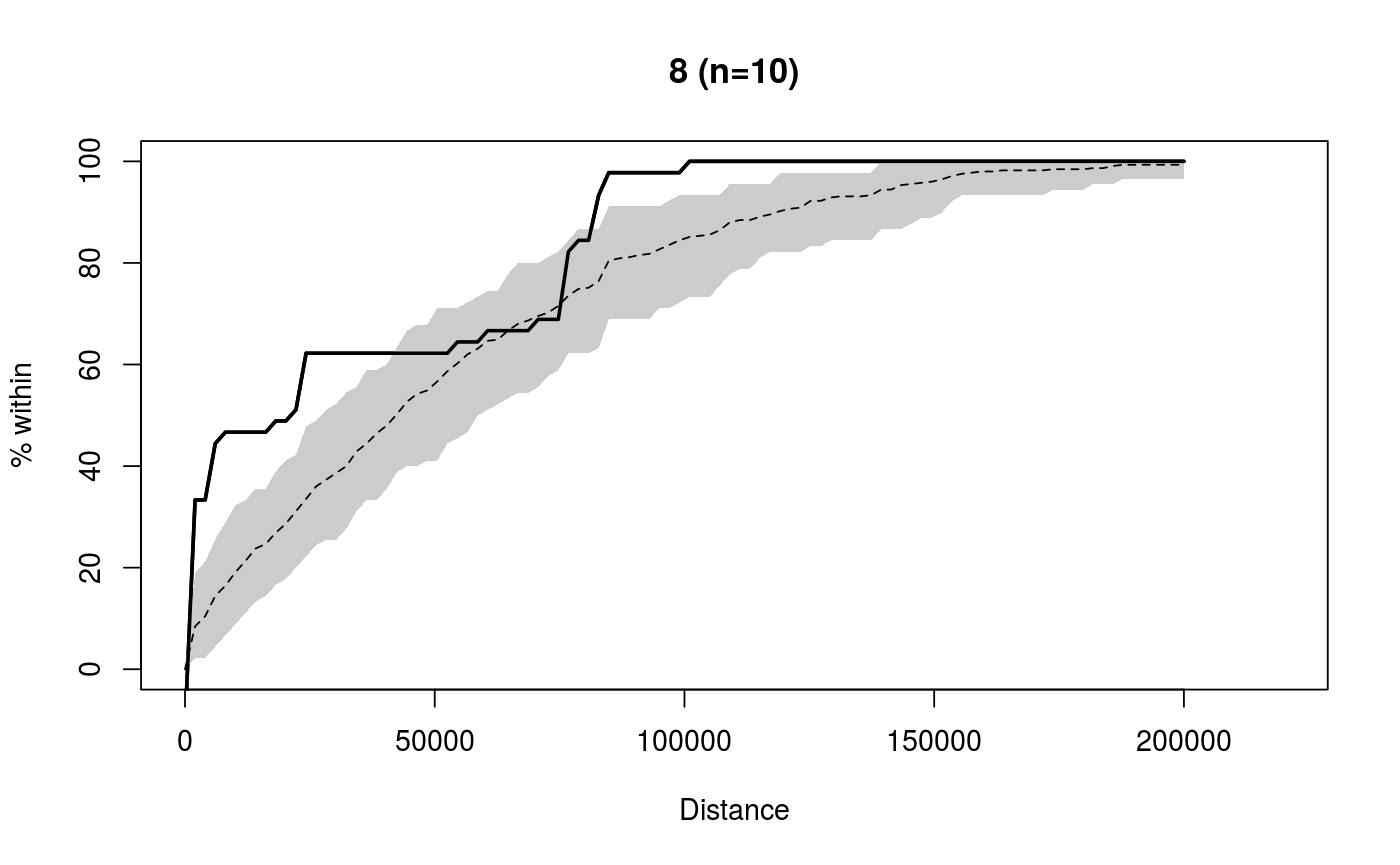
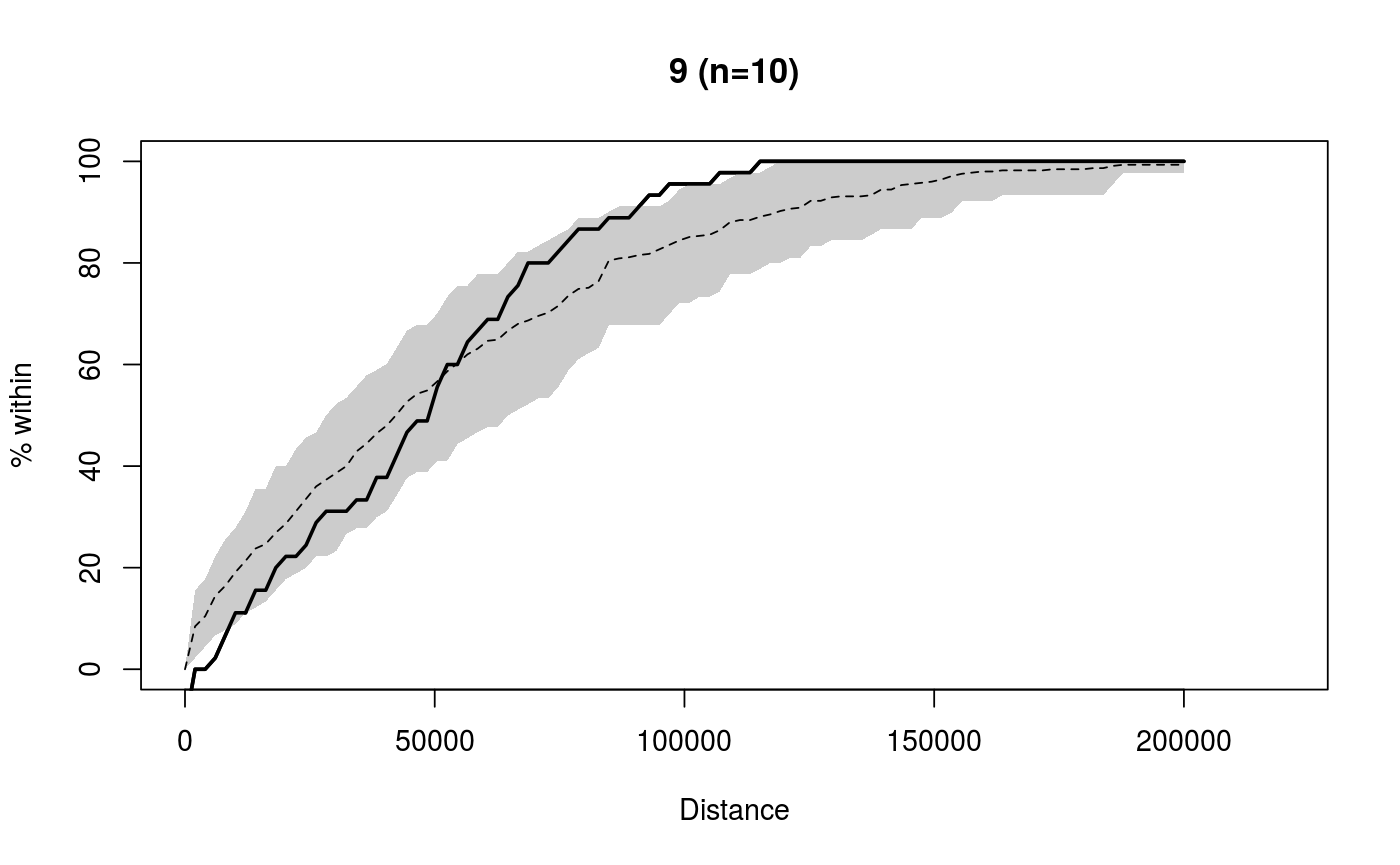
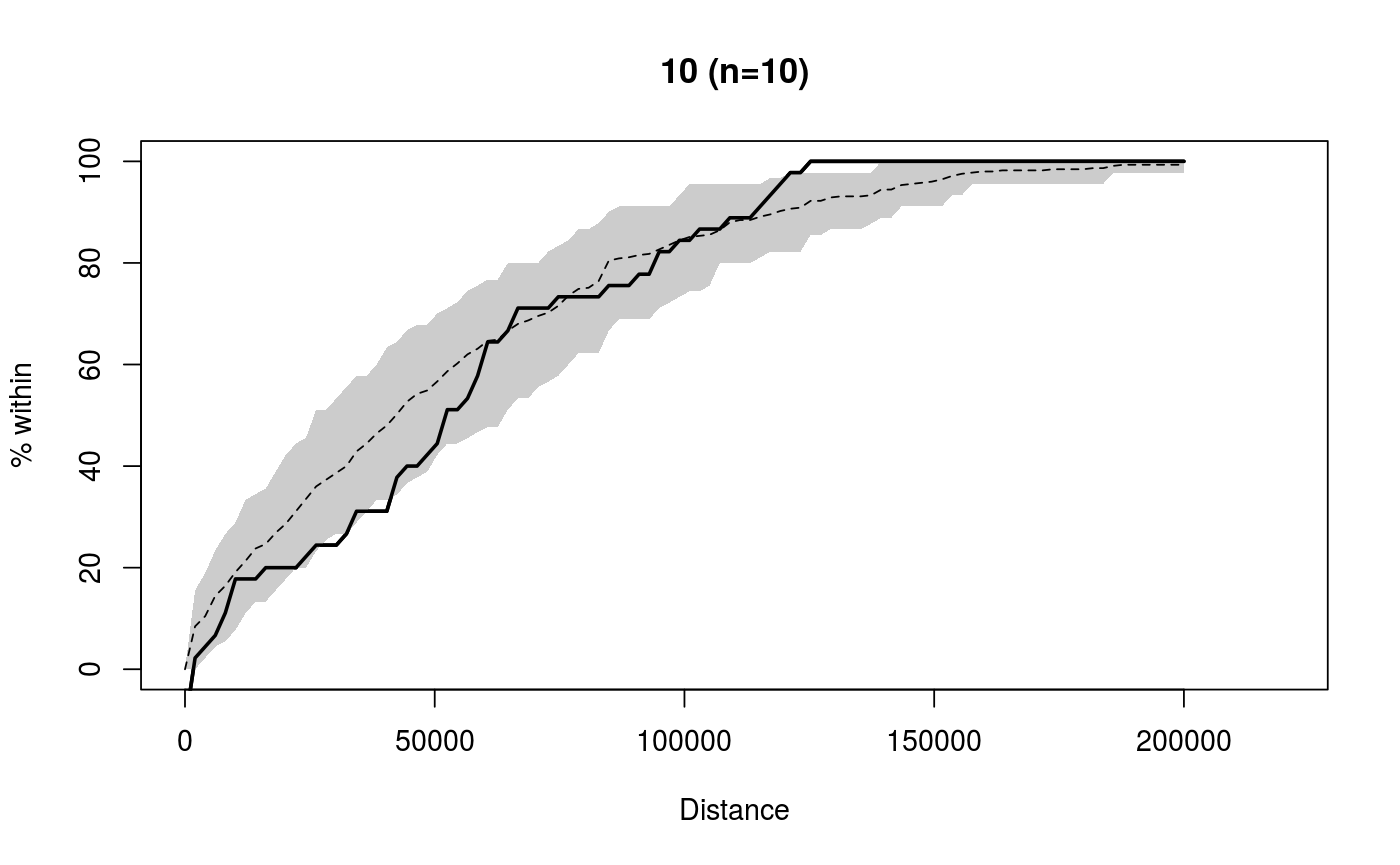
Plots K-functions for locations in each of a set of surveys. In this implementation, this can be interpreted as the proportion of additional fish within a given distance. This will increase as a function of distance, and may provide evidence of clustering or dispersion features, particularly if the envelope is used.
kfunc(seg, vert, survey = NULL, rivers, lwd = 2, envelope = TRUE,
  envreps = 1000, envcol = "grey80", envborder = NA, maxdist = NULL,
  xlab = "Distance", ylab = "% within", showN = TRUE,
  whichplots = NULL, returnoutput = FALSE, ...)
Arguments
| seg | A vector of river locations (segment) |
|---|---|
| vert | A vector of river locations (vertex) |
| survey | A vector of survey IDs corresponding to the values of
|
| rivers | The river network object to use |
| lwd | Line width used for plotting. Defaults to 2. |
| envelope | Whether to construct and display a 95 percent confidence
envelope (see note.) Defaults to |
| envreps | Number of bootstrap replicates to use for envelope calculation. Defaults to 1000. |
| envcol | Color to use for envelope plotting. Defaults to
|
| envborder | Border color to use for envelope plotting. Defaults to
|
| maxdist | Maximum distance (x-axis value) for plotting. The default
value ( |
| xlab | X-coordinate label for plotting |
| ylab | Y-coordinate label for plotting |
| showN | Whether to show the sample size for each survey in each plot
title. Defaults to |
| whichplots | A vector of plots to produce, if multiple plots are
produced. For example, specifying |
| returnoutput | Whether to return output instead of producing a plot. Defaults to |
| ... | Additional plotting parameters. |
Note
K-function envelopes for each survey are constructed by bootstrapping all within-survey distances, that is, the distances between all individuals within each survey, for all surveys. This results in a confidence envelope under the assumption that spacing is independent of survey; therefore a survey K-function outside the envelope provides evidence of clustering or dispersal in that survey that is outside the typical range. An envelope is not available if only one survey is plotted.
A K-function above the envelope for a given distance range provides evidence of a greater number of individuals than expected at that distance range (clustering); A K-function below the envelope for a given distance range provides evidence of a smaller number of individuals than expected at that distance range (dispersal).
This function is distance-computation intensive, and will be extremely slow-running if a river network is used that does not have segment routes and/or distance lookup tables for fast distance computation. See buildsegroutes and/or buildlookup for more information.
Examples
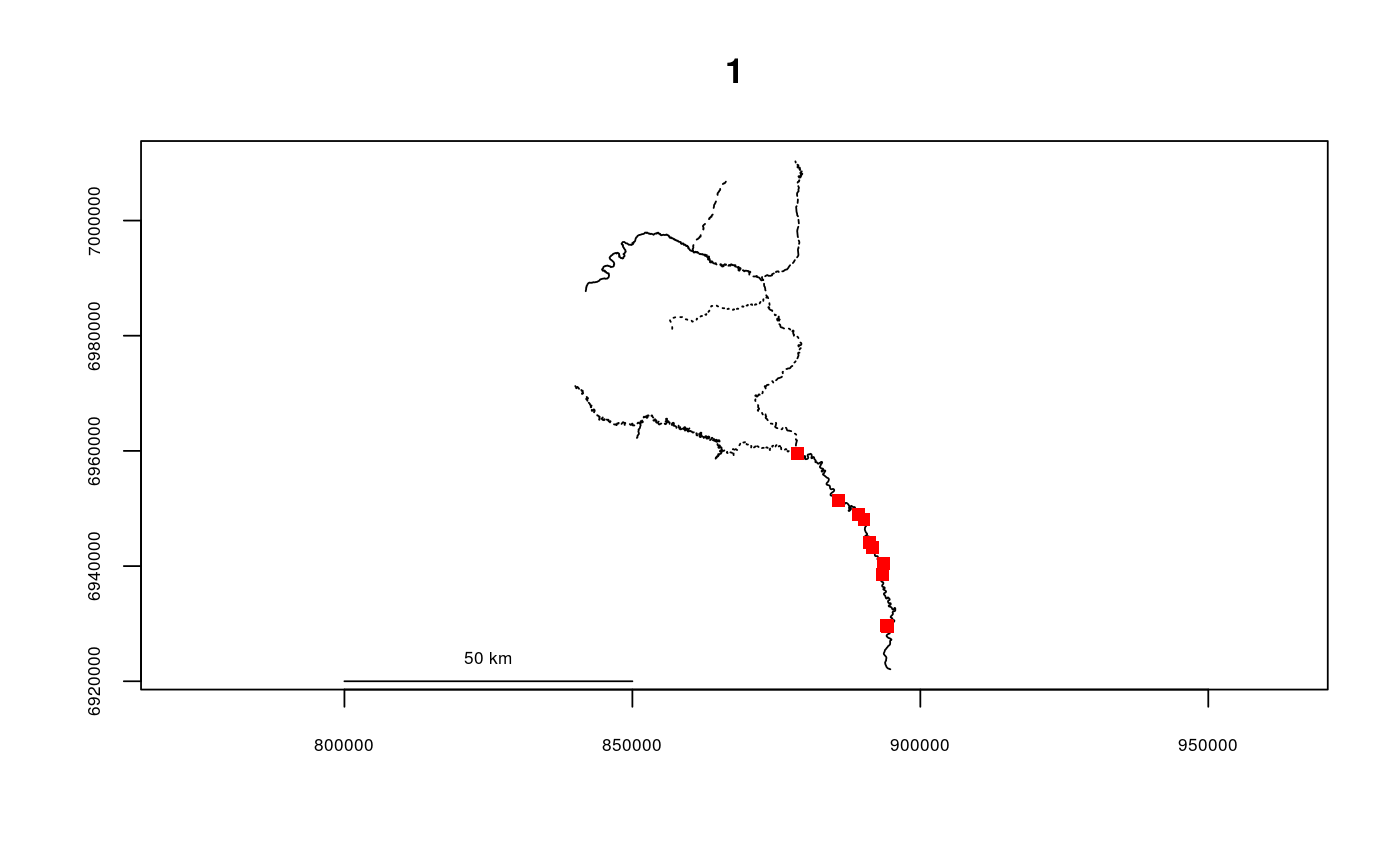
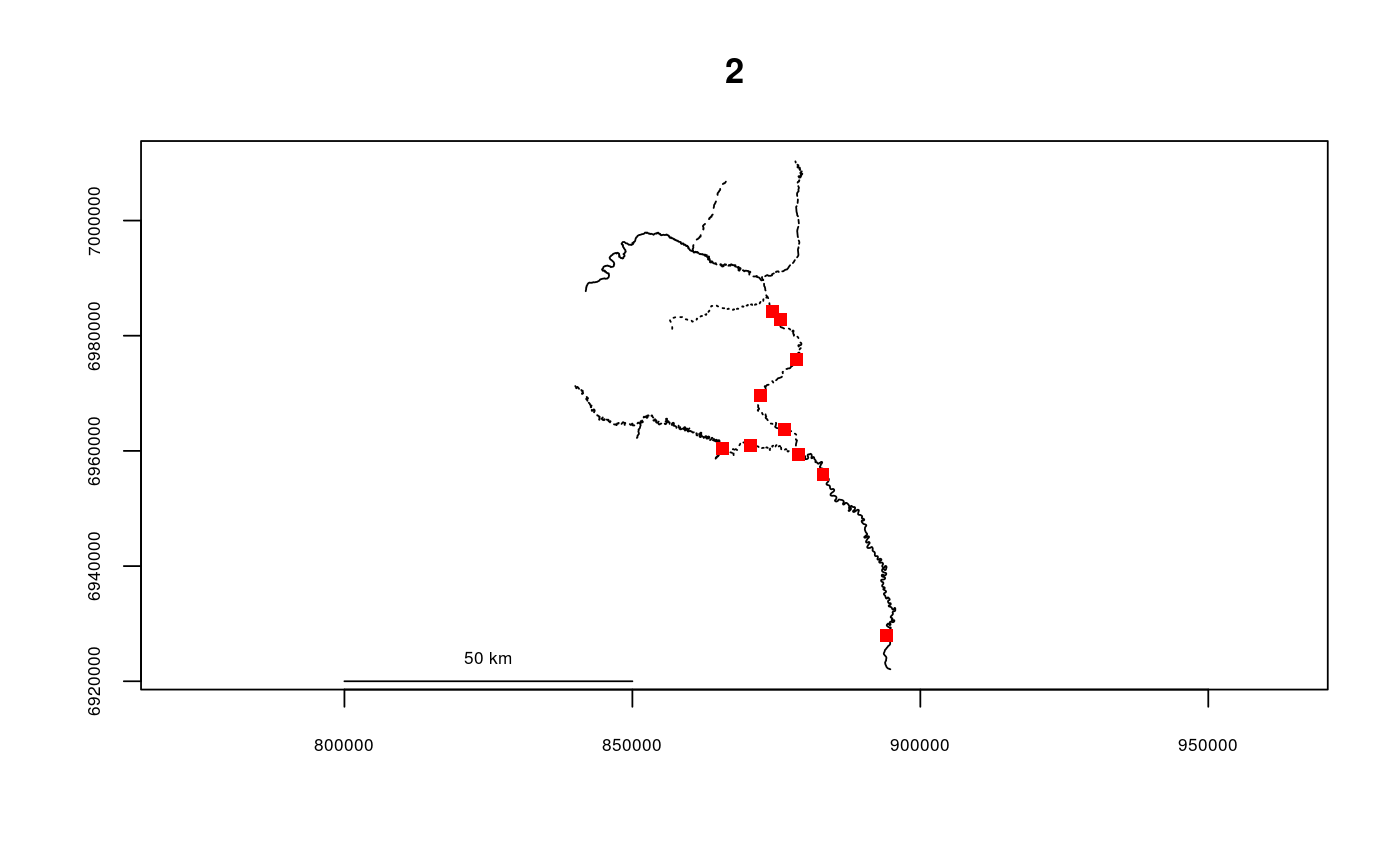
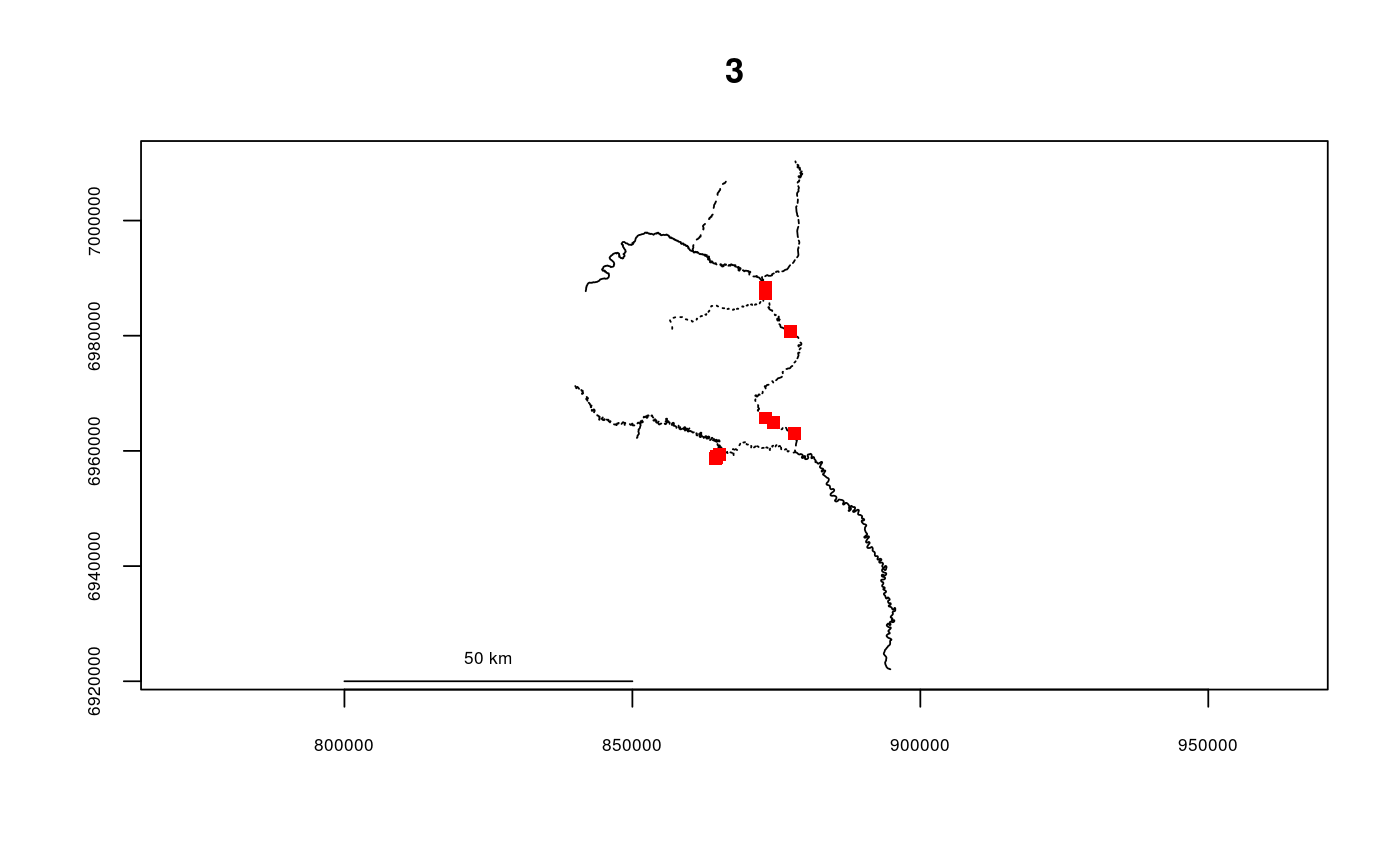
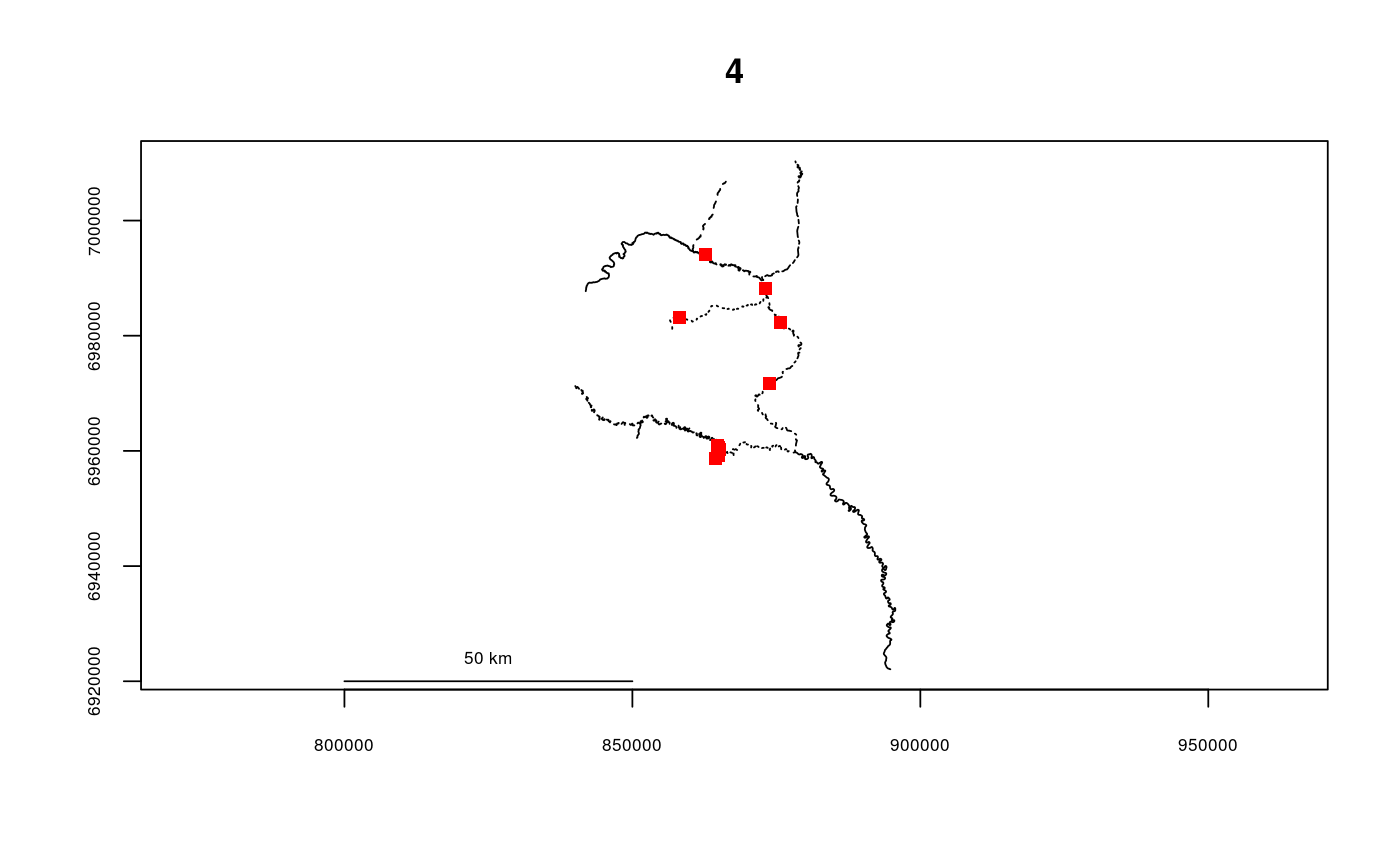
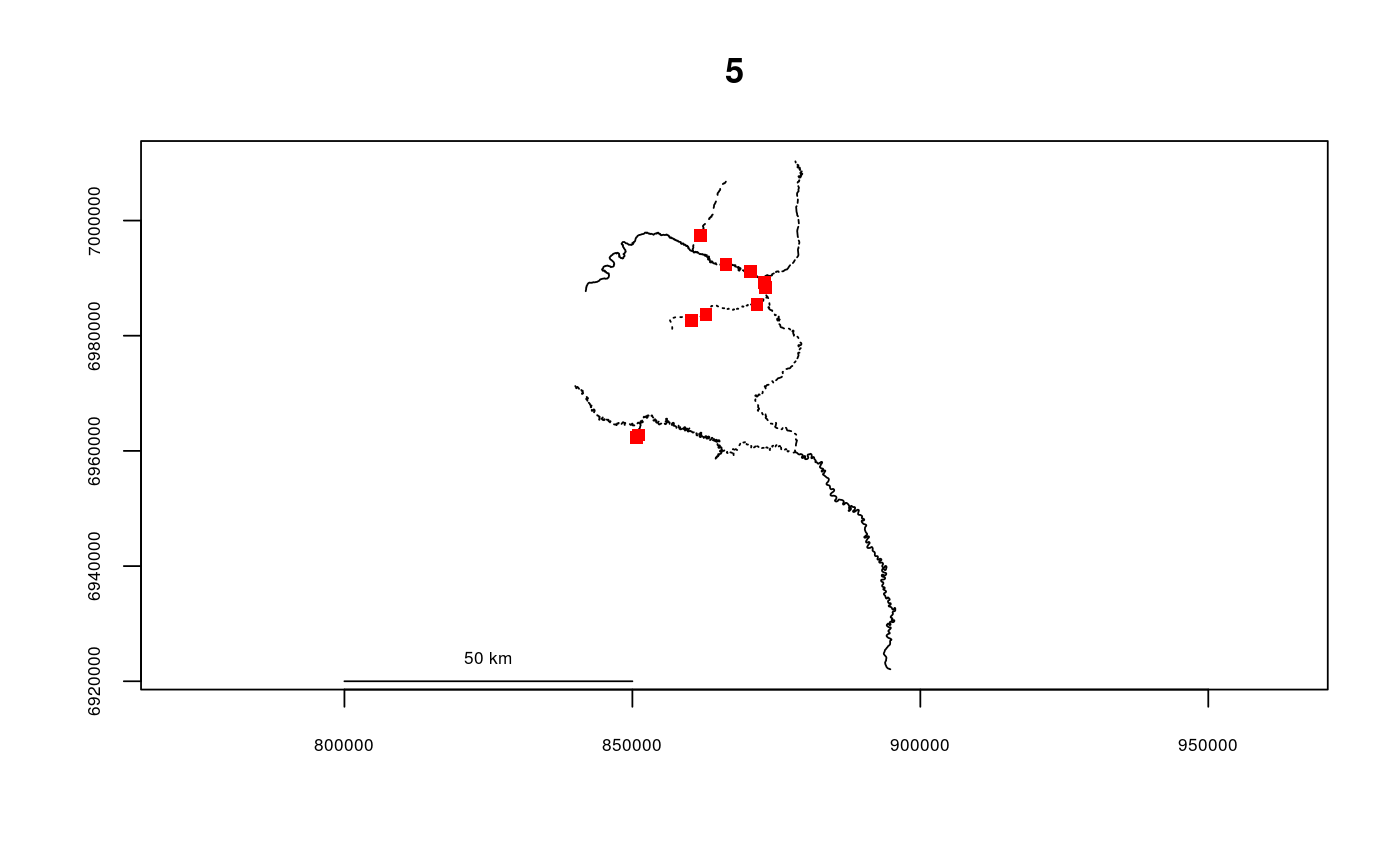
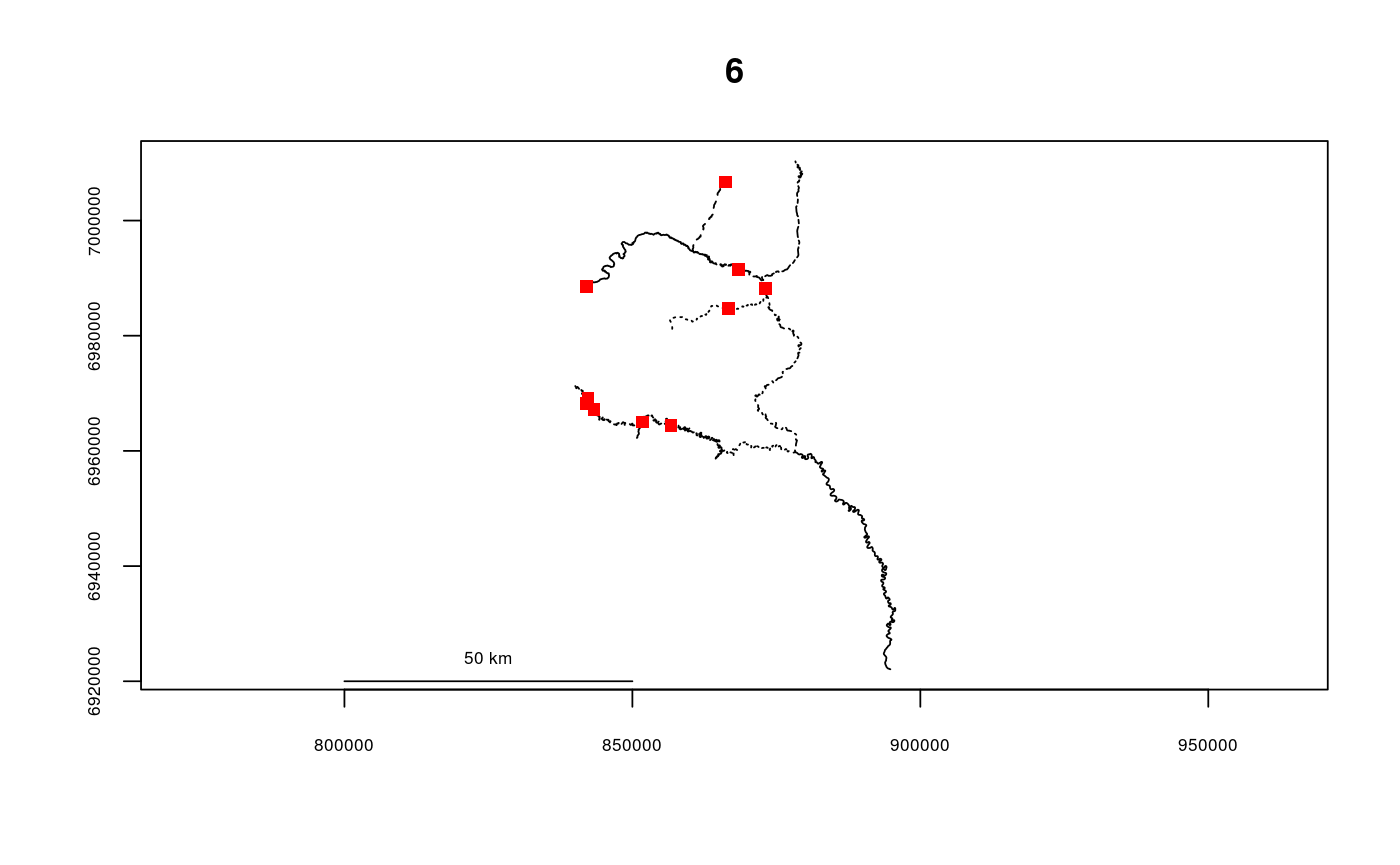
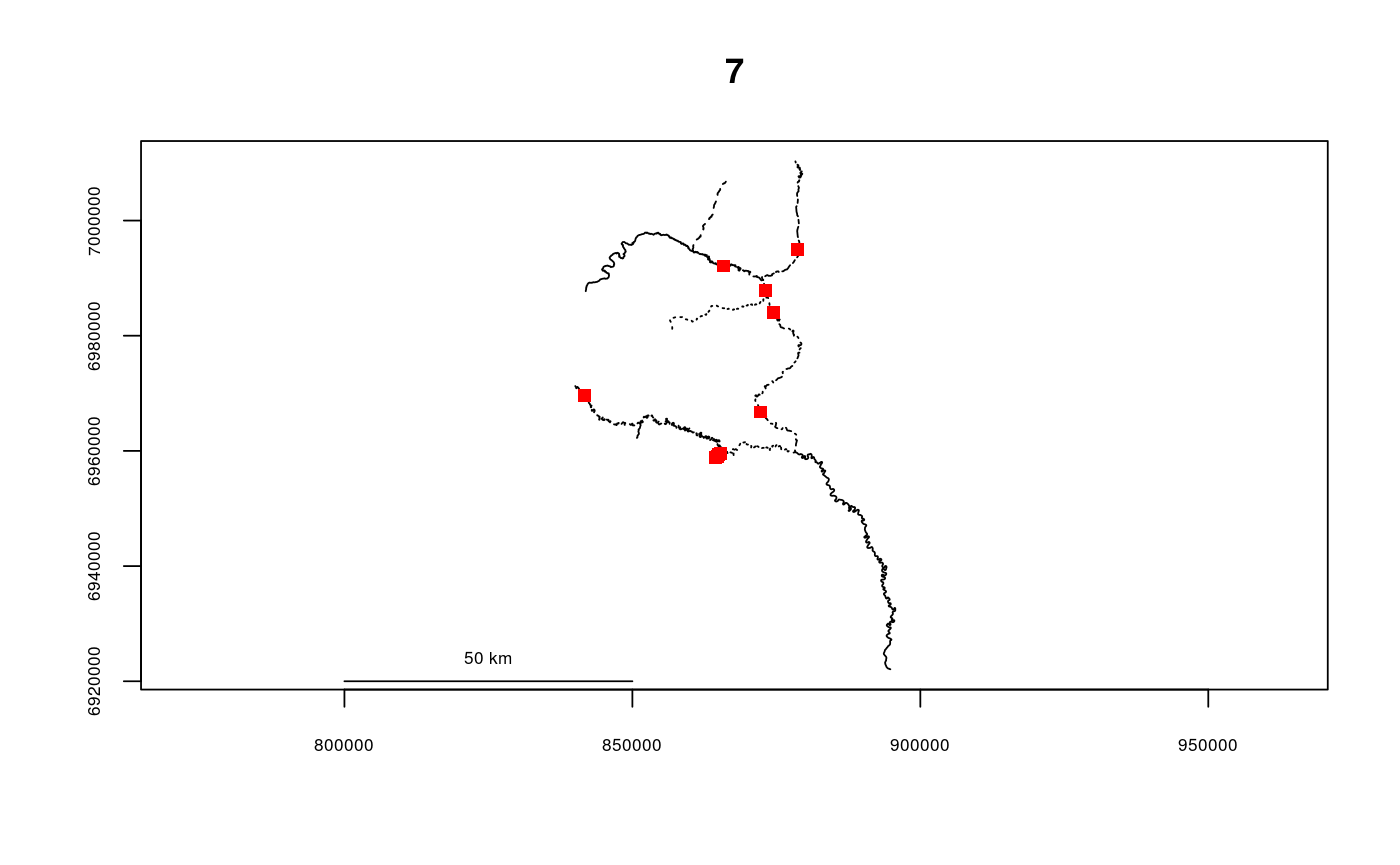
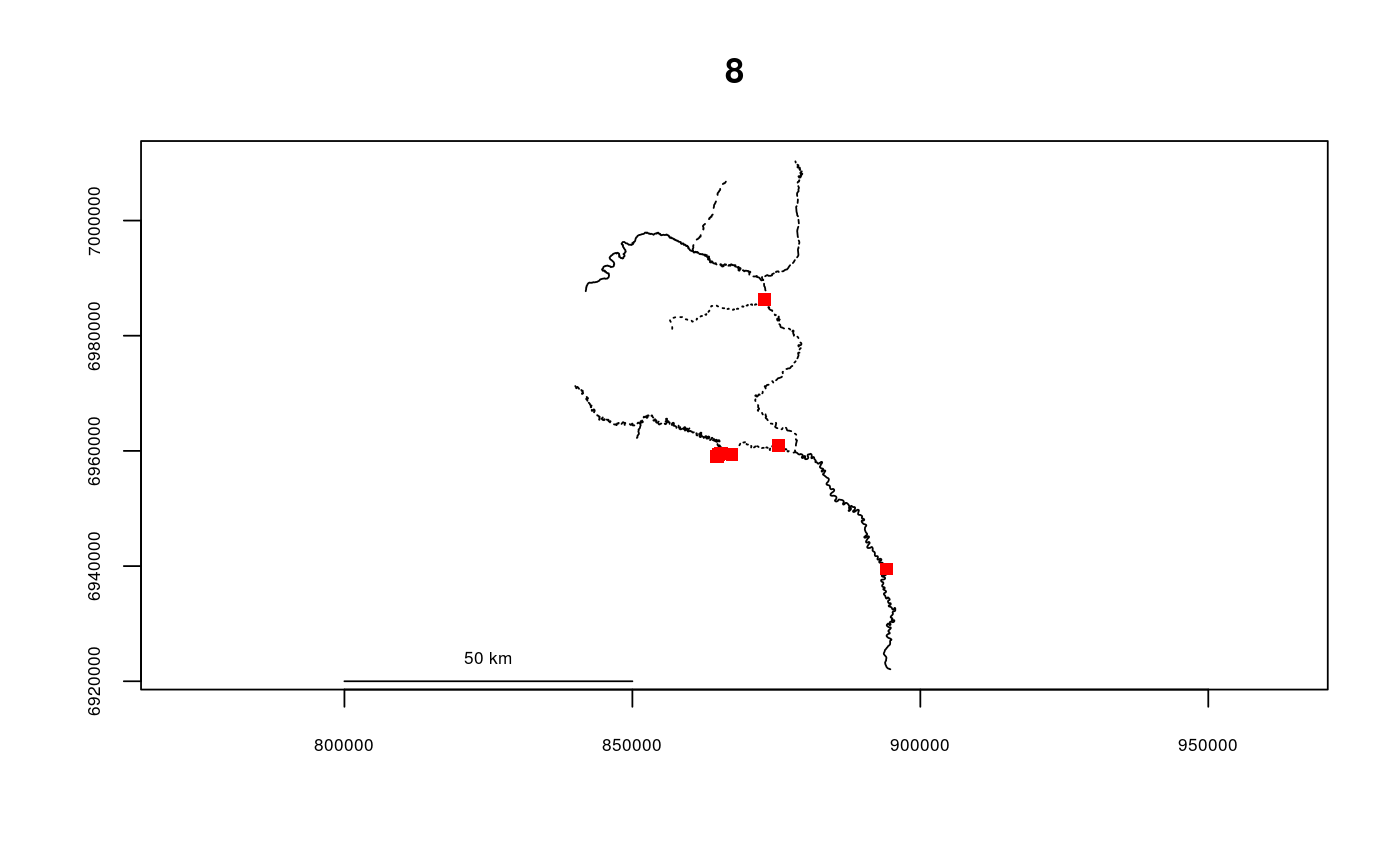
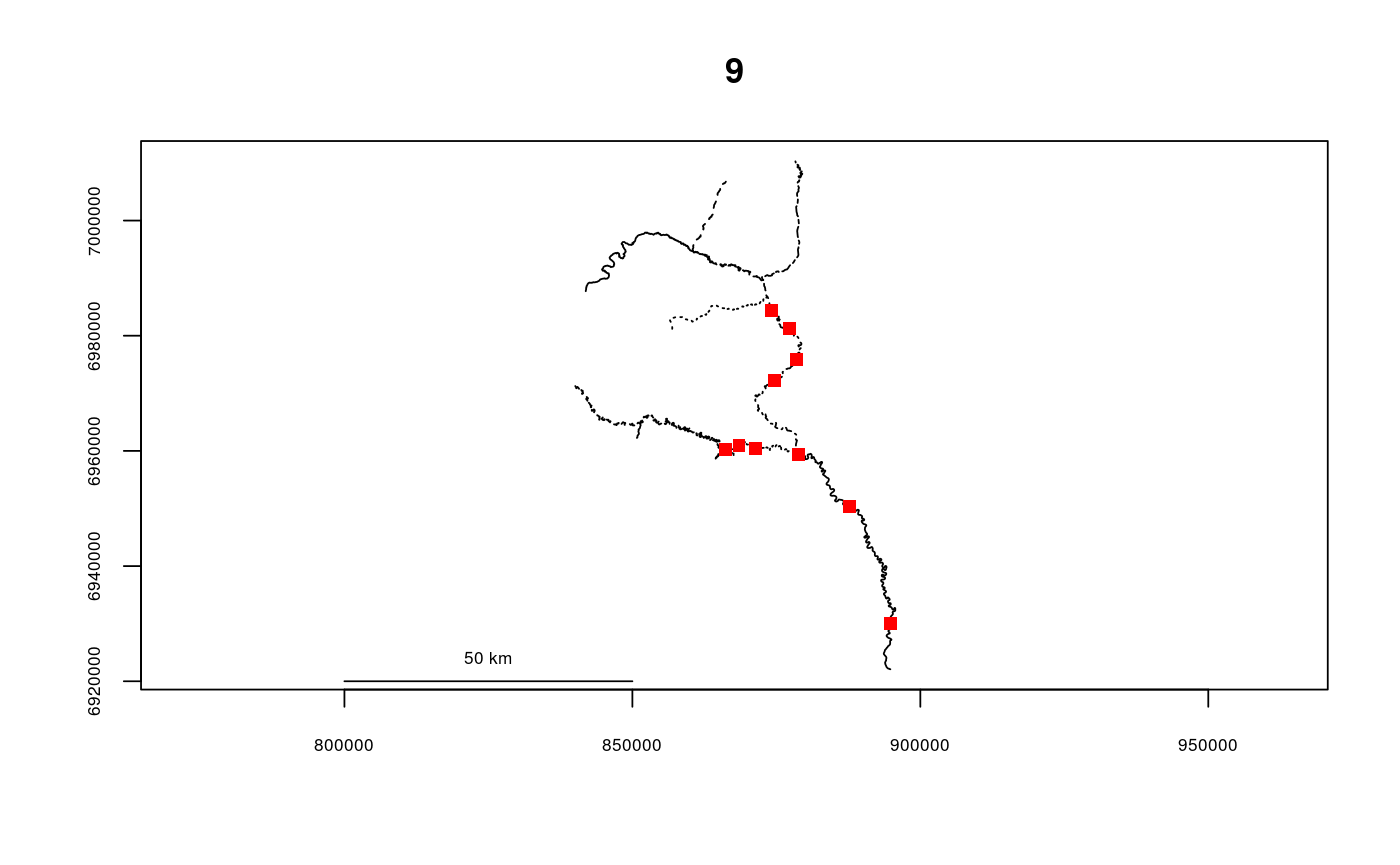
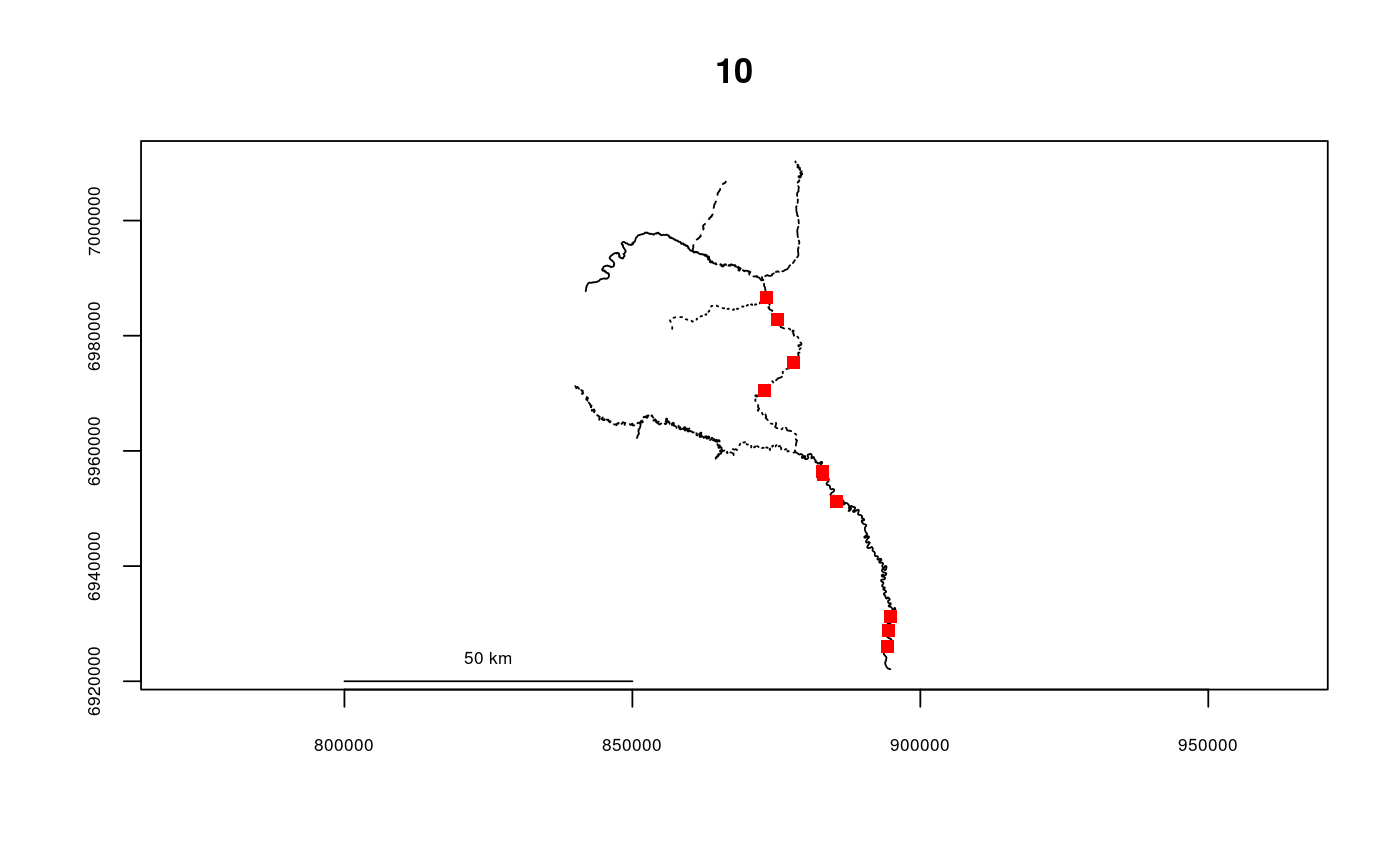
data(Gulk, fakefish) # # 10 plots will be created - recommend calling # # par(mfrow=c(3,4)) kfunc(seg=fakefish$seg, vert=fakefish$vert, rivers=Gulk, survey=fakefish$flight, envreps=100, maxdist=200000)# # This shows relatively high amounts of clustering for surveys 1 and 8, # # and relatively high amounts of dispersal in surveys 5 and 6. # # plotting the survey locations that led to this calculation, for comparison # # 10 plots will be created - recommend calling # # par(mfrow=c(3,4)) for(i in 1:10) { plot(x=Gulk, segmentnum=FALSE, color=FALSE, main=i) riverpoints(seg=fakefish$seg[fakefish$flight==i], vert=fakefish$vert[fakefish$flight==i], rivers=Gulk, col=2, pch=15) }
