Draw Points from River Locations
Adds points to an active plot. Works like points but with river locations (segments and vertices) rather than xy coordinates.
riverpoints(seg, vert, rivers, pch = 1, col = 1, jitter = 0, ...)
Arguments
| seg | A vector of segments |
|---|---|
| vert | A vector of vertices |
| rivers | The river network object to use |
| pch | Point character, as a vector or single value |
| col | Point color, as a vector or single value |
| jitter | Maximum amount of random noise to add to "jitter" points if desired, so points do not overlap one another |
| ... | Additional arguments for points |
Examples
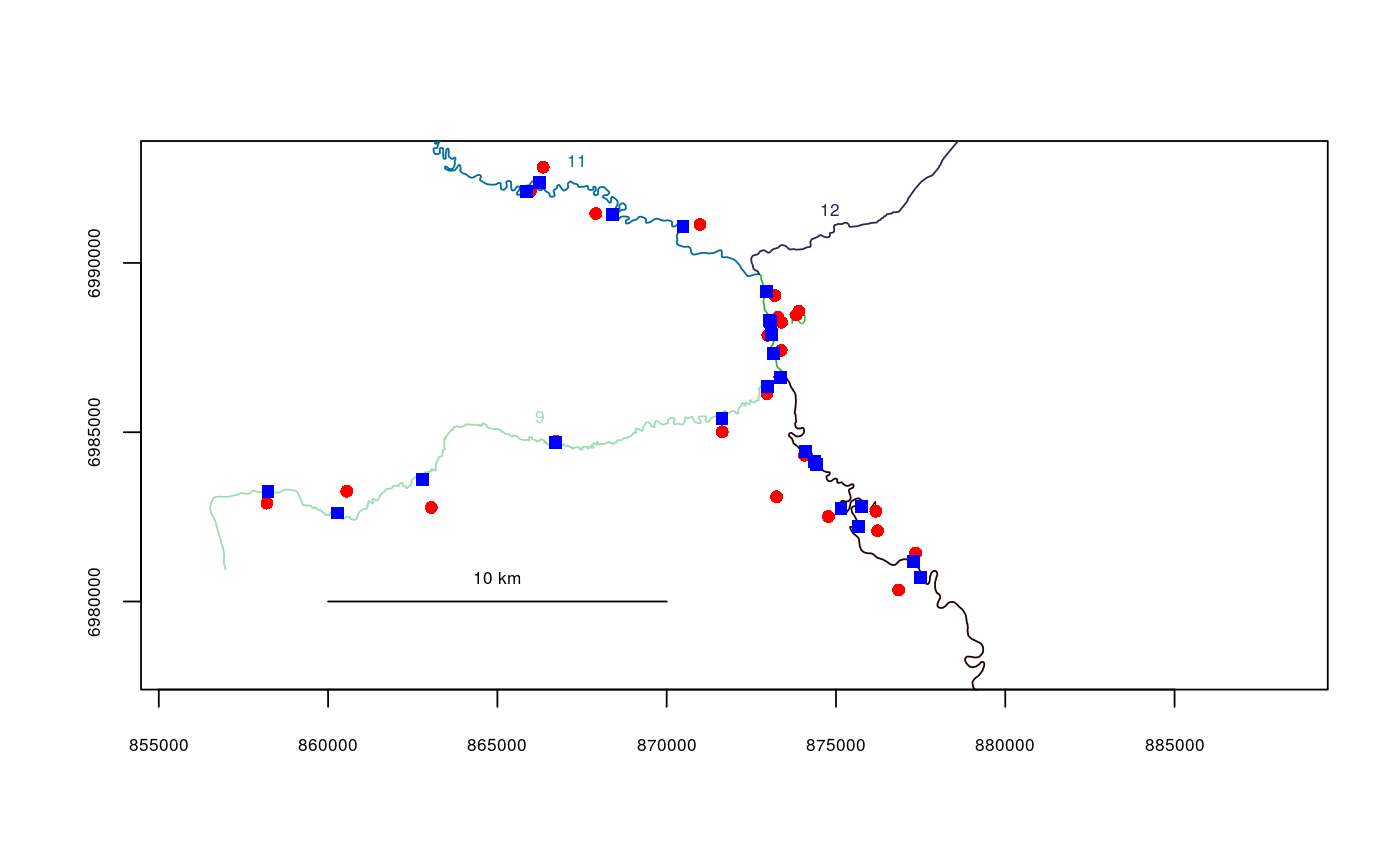
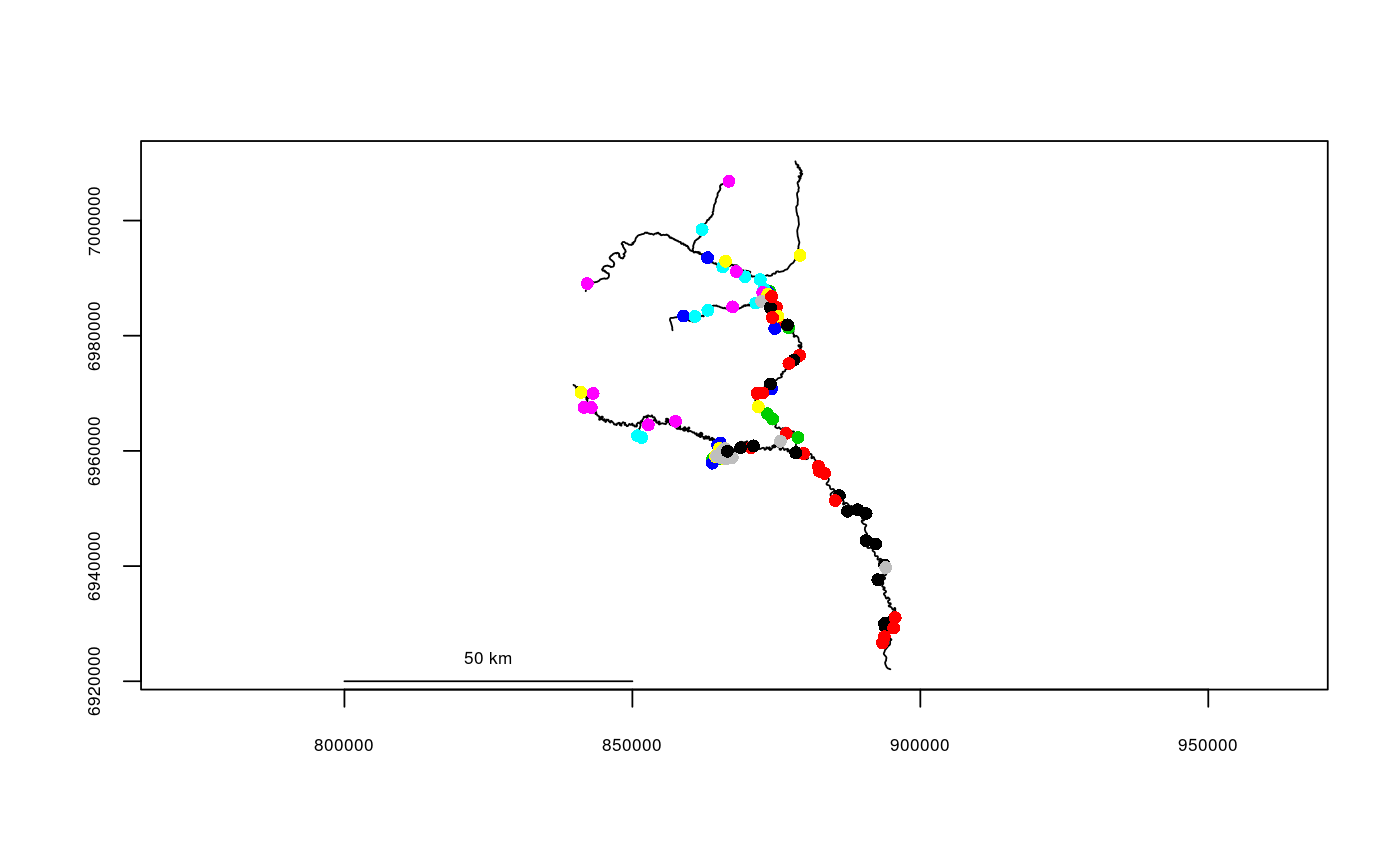
data(fakefish,Gulk) plot(x=Gulk, xlim=c(862000,882000), ylim=c(6978000,6993000))points(x=fakefish$x, y=fakefish$y, pch=16, col=2)riverpoints(seg=fakefish$seg, vert=fakefish$vert, rivers=Gulk, pch=15, col=4)plot(x=Gulk, empty=TRUE)with(fakefish, riverpoints(seg=seg, vert=vert, rivers=Gulk, pch=16, col=flight, jitter=1000))

