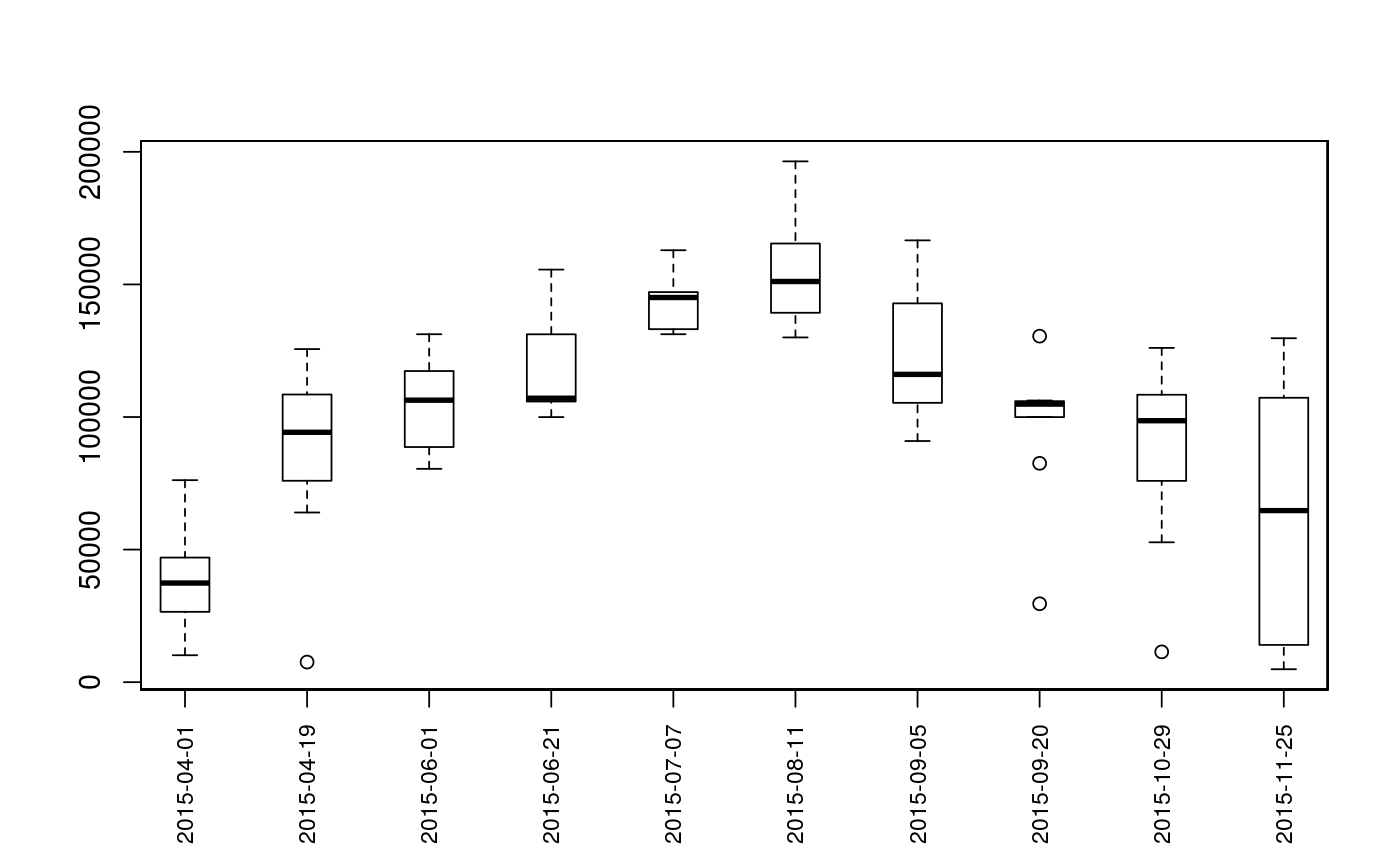
Distance From Mouth for All Observations of Individuals
Calculates distance from the mouth of a river network to all observations of each individual (given as segment and vertex). and the specified mouth of the river network. The mouth must first be specified (see setmouth). Returns a matrix of distances, with a row for each unique individual and a column for each survey.
A plotting method is provided for the output; see plotseq.
mouthdistbysurvey(unique, survey, seg, vert, rivers, logical = NULL,
  stopiferror = TRUE, algorithm = NULL)
Arguments
| unique | A vector of identifiers for each fish. |
|---|---|
| survey | A vector of identifiers for each survey. It is recommended to use a numeric or date format (see as.Date) to preserve survey order. |
| seg | A vector of river locations (segment) |
| vert | A vector pf rover coordinates (vertex) |
| rivers | The river network object to use |
| logical | A boolean vector that can be used for subsetting - if used,
|
| stopiferror | Whether or not to exit with an error if a route cannot be
found. If this is set to |
| algorithm | Which route detection algorithm to use ( |
Value
A vector of river network distances (numeric), with each row
corresponding to a unique fish and each column corresponding to a unique
survey. Values of NA indicate the individual not being located
during the survey in question.
Note
Building routes from the river mouth to each river network segment and/or distance lookup tables will greatly reduce computation time (see buildsegroutes).
See also
Examples
data(Gulk, fakefish)

seqbysurvey <- mouthdistbysurvey(unique=fakefish$fish.id, survey=fakefish$flight.date,
    seg=fakefish$seg, vert=fakefish$vert, rivers=Gulk)
seqbysurvey#>    2015-04-01 2015-04-19 2015-06-01 2015-06-21 2015-07-07 2015-08-11 2015-09-05
#> 1    26534.79  121618.71         NA  131181.97   162898.7         NA         NA
#> 2    10333.14         NA         NA  105166.44         NA         NA         NA
#> 3          NA    7581.28  106455.35         NA   150985.9   164013.1  125509.38
#> 4          NA  108482.38  117333.91         NA   145337.6   131182.0  146021.47
#> 6          NA  125609.77         NA         NA         NA   165422.9  105343.62
#> 7    10153.31   75960.58   88671.64  155589.45   131217.7         NA         NA
#> 8    56016.35         NA  106900.86         NA         NA         NA  166605.91
#> 9    46998.40   96425.17  130164.06  106331.24         NA         NA         NA
#> 10   36393.18         NA         NA   99957.61   132169.8         NA         NA
#> 11   76179.64         NA         NA         NA         NA   139312.8         NA
#> 12         NA   63984.42         NA  106900.86         NA         NA  130796.38
#> 13         NA         NA         NA  120678.71   145369.9   174795.4  142848.68
#> 14   31501.59         NA   80464.91  105834.87   144799.8   140777.9  106050.39
#> 15         NA   92049.56  131217.71         NA   147100.8   130008.5         NA
#> 16   45619.26         NA         NA         NA         NA         NA  106656.16
#> 17   38397.33         NA  105164.86         NA   133124.1   160211.9         NA
#> 18         NA   83037.47   86456.72  153561.04         NA         NA   90940.39
#> 19         NA  103833.43         NA  107267.49         NA   196410.8         NA
#> 20         NA         NA  106259.56         NA   136399.6   141994.0  104878.99
#>    2015-09-20 2015-10-29 2015-11-25
#> 1   105965.92  101515.96  65372.989
#> 2    99971.64         NA         NA
#> 3   106236.77  102426.58  14045.560
#> 4          NA         NA   4877.794
#> 6          NA  108397.95         NA
#> 7          NA         NA         NA
#> 8   104744.95   95707.34  64040.963
#> 9   105343.62         NA 122739.049
#> 10   82536.96   75915.69         NA
#> 11  104849.94   11434.10 107264.897
#> 12         NA         NA  97886.487
#> 13         NA         NA         NA
#> 14         NA  126069.62  56293.094
#> 15         NA   52750.62         NA
#> 16  104878.99  117856.14   8714.121
#> 17         NA         NA         NA
#> 18         NA         NA 129705.522
#> 19  130492.67   89983.12         NA
#> 20   29573.62         NA         NAplotseq(seqbysurvey)
