Highlight Segments
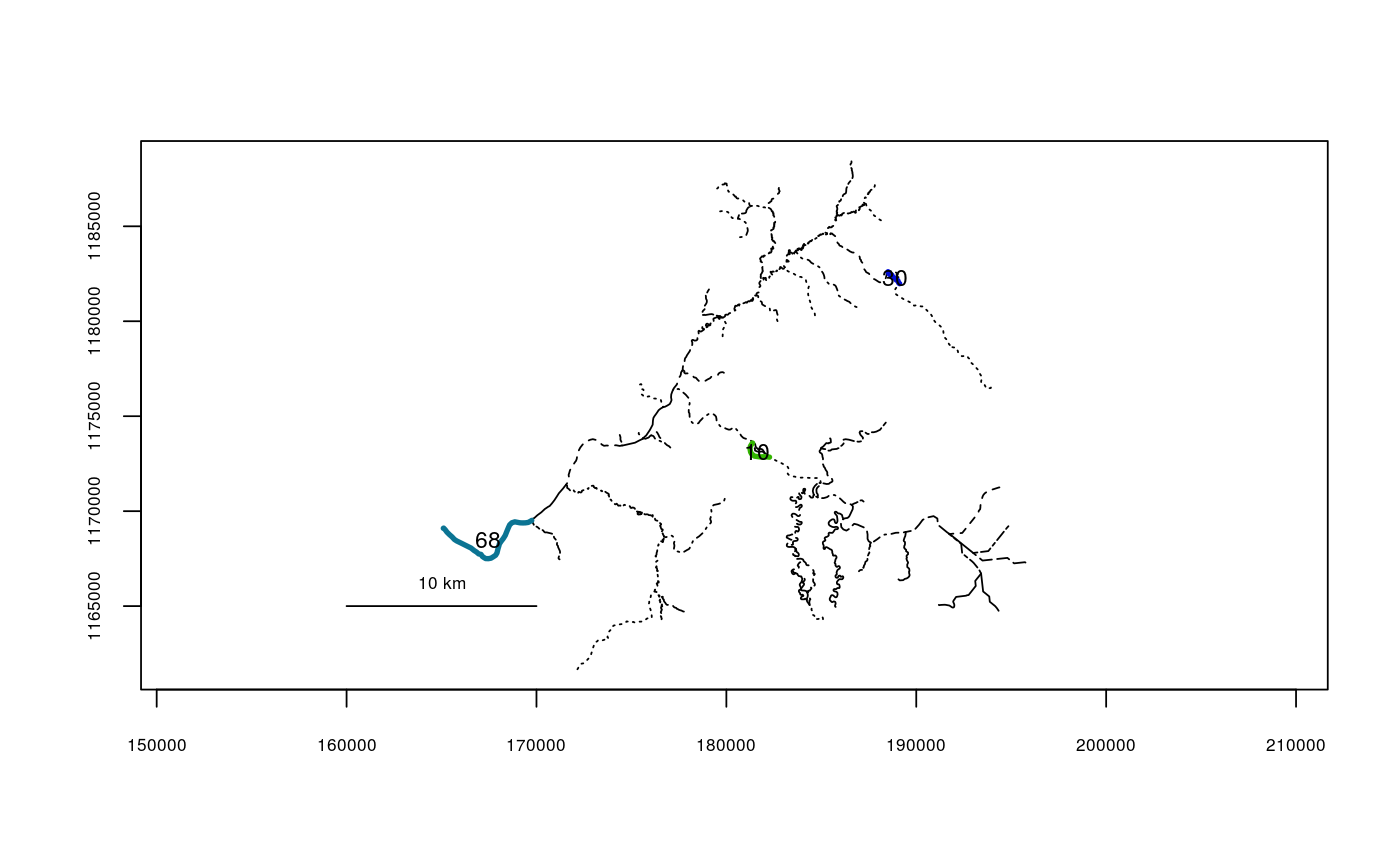
Plots a river network object and displays specified segments in bold, for easy identification.
highlightseg(seg, rivers, cex = 0.8, lwd = 3, add = FALSE,
  color = FALSE, ...)
Arguments
| seg | A vector of segments to highlight |
|---|---|
| rivers | The river network object to use |
| cex | The character expansion factor to use for segment labels |
| lwd | The line width to use for highlighted segments |
| add | Whether to add the highlighted segments to an existing plot ( |
| color | Whether to display segment labels as the same color as the segments. Defaults to |
| ... | Additional plotting arguments (see par) |
Examples
data(Kenai3)
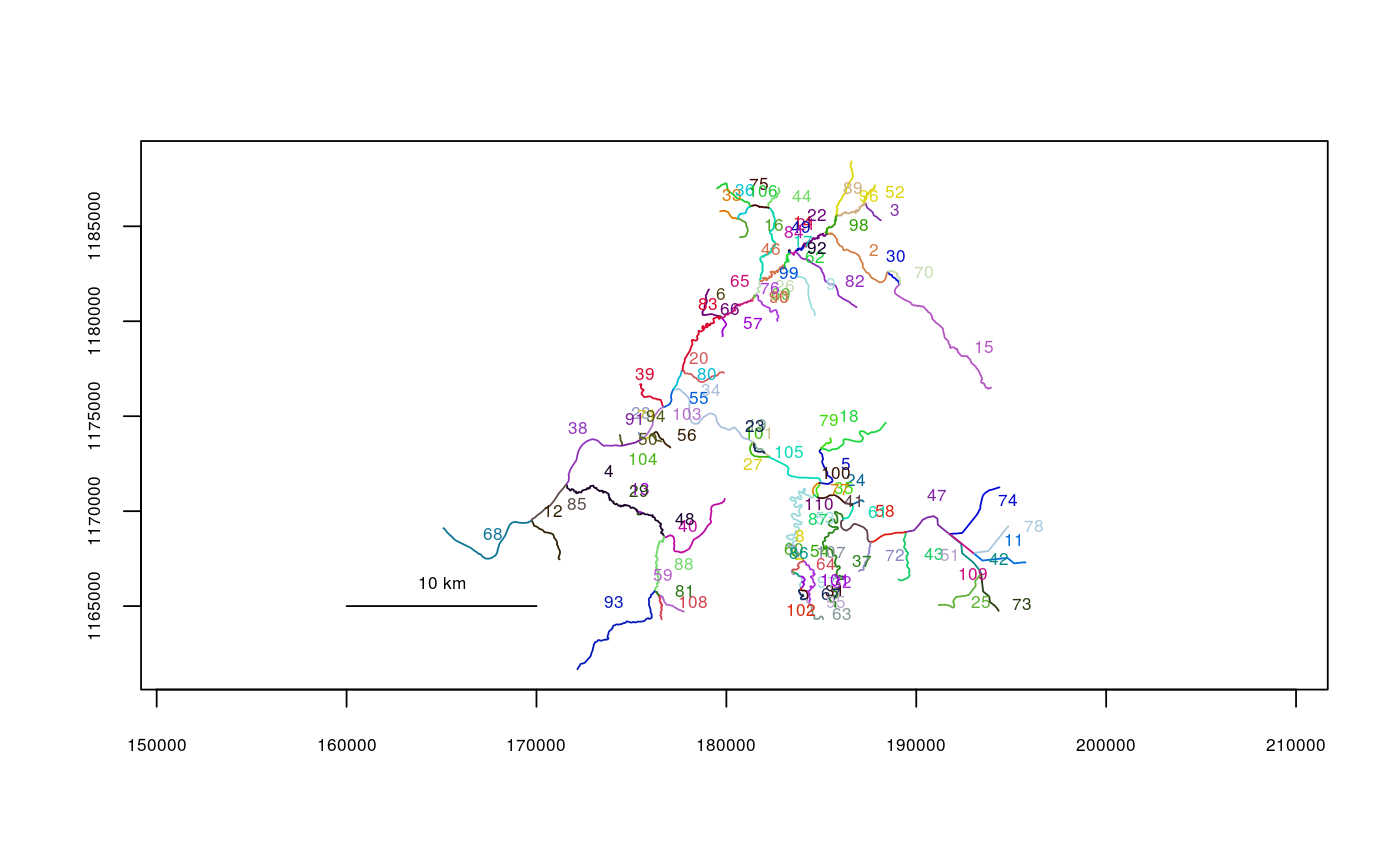
plot(Kenai3)highlightseg(seg=c(10,30,68),rivers=Kenai3)

